Having your own working capital is the key to successful operation of an enterprise. The indicator is used to assess the real volume of an organization's resources and indicates whether there is free money. This is an absolute value and is expressed in monetary terms. To calculate it, it is most convenient to refer to the balance sheet data.
Managing an enterprise involves making decisions that will lead to profit in the future. The main source of income is the results of conducting core activities, the implementation of which requires resources. One of the key assets of any enterprise is its own working capital. They belong to current assets and are considered the most liquid, i.e. can be quickly converted into hard cash.
Definition
Own working capital (SOC) is the cost of the excess of current assets over short-term liabilities. In another way, this source of financing is called working capital. These are funds that are deposited on the company’s balance sheet and are used to finance current activities.
SOS show how much money a company has, the amount of capital it can freely manage, including to cover short-term liabilities.
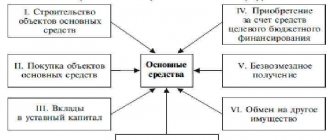
Sources of SOS formation:
- net profit;
- reserve and other financial funds;
- authorized capital;
- targeted financing of the organization from the state.
Calculation formula
Own working capital is found in several ways. This is always an absolute value and is expressed only in monetary terms, in contrast to the various coefficients derived from it.
1 formula:
SOS = AO - OK, where:
- JSC – current assets;
- OK – short-term liabilities.
Current assets are circulating funds and circulation funds. These include raw materials, supplies, fuel, finished products, and accounts receivable. The indicator is expressed in money.
According to the balance, the SOS value is found as follows:
SOS = page 1200 – page 1500, where:
- Page 1200 – line value 1200 (total for section II);
- Page 1500 – line value 1500 (total for section IV).
2 formula:
SOS = (KS + OD) - AB, where:
- KS – equity capital;
- OD – long-term liabilities;
- AB – non-current assets.
The balance sheet looks like this:
SOS = page 1300 + page 1400– page 1100, where:
- Page 1300 – line value 1300 (total capital);
- Page 1530 – line value 1400 (long-term liabilities);
- Page 1100 – value of line 1100 (cost of non-current assets).
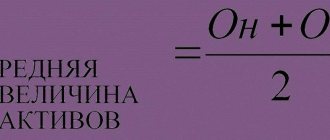
For all formulas, data for calculations should be taken for a certain period. If you have figures for the beginning and end of the period, you can find the average value in this way (using the example of Ks - equity capital):
Δ KS = (KS LF + KS CP) / 2, where:
- KS NC – the amount of equity capital at the beginning of the period;
- KS KP – the amount of equity capital at the end of the period.
Calculation example
For ease of calculation, let’s take the balance sheet data.
It is best to use the first formula with two variables. An example calculation is available. Table 1. Calculation example, thousand rubles.
| Month and year | Line 1200 | Line 1500 | SOS |
| January 2017 | 1 500 | 1 200 | 300 |
| February 2017 | 1 700 | 1 520 | 180 |
| March 2017 | 1 350 | 1 580 | -230 |
| April 2017 | 1 560 | 1 250 | 310 |
| May 2017 | 1 750 | 1 260 | 490 |
| June 2017 | 1 840 | 1 345 | 495 |
| July 2017 | 1 950 | 1 580 | 370 |
| August 2017 | 1 850 | 1 650 | 200 |
| September 2017 | 1 840 | 1 440 | 400 |
| October 2017 | 1 760 | 1 380 | 380 |
| November 2017 | 1 830 | 1 280 | 550 |
| December 2017 | 1 750 | 1 270 | 480 |
| Total for the year | 20 680 | 16 755 | 3925 |
| Average per month | 1 723,3 | 1 396,3 | 327,1 |
Thus, the company experienced a surplus of its own working capital in all months of 2020, except one. The deficit was noted only in March and amounted to minus 230 thousand rubles. In general, for the remaining months the amount of own working capital was relatively stable. On average for the year, the amount of SOS was equal to 327.1 thousand rubles.
Rice. 1. SOS in dynamics on the chart
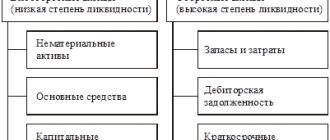
What is included in current assets on the balance sheet?
Working capital in the balance sheet is allocated to the 2nd section with the same name. This asset section of the balance sheet reflects current assets by line:
| Asset name | № lines |
| Reserves | 1210 |
| VAT on purchased assets | 1220 |
| Accounts receivable | 1230 |
| Financial investments | 1240 |
| Cash and cash equivalents | 1250 |
| Other current assets | 1260 |
| The total value of the company's OA | 1200 |
Let us briefly describe each group of listed assets:
- The inventory block, in addition to those used as raw materials in the production of products, combines the following assets:
— costs in work in progress, since the technical process in the company does not stop at the end of the month;
- farmed animals that are a product of animal husbandry;
— finished (not yet sold) products stored in a warehouse;
— shipped goods, i.e. on the way to the buyer;
— deferred expenses (FPR);
- other supplies.
- VAT on purchased assets as of the reporting date represents the balance of tax not accepted for deduction.
- Accounts receivable is the total amount of debts owed to the company, but not received at the balance sheet date.
- Financial investments (except cash equivalents) are investments with a maturity of up to a year. These may include securities - debt or issued by commercial, municipal or government agencies, deposits in management companies of other companies or loans issued to them, deposits in banks or receivables acquired under an assignment of rights of claim;
- Cash in hand and in bank accounts;
- Other current assets on the balance sheet are the value of assets that are not reflected in other lines of the balance sheet. For example, among others, they take into account the cost of missing inventory items, for which there is no decision to write off the losses or the culprits, VAT on advances, the amount of overpaid taxes and fines, for which no decision has been made on offset or refund, etc.
The final amount of working capital in the balance sheet is line 1200. It accumulates information about the size of the company’s working capital.
Standard value
The cost of working capital can take on both positive and negative values. A SOS reading above zero is considered normal. More specific figures depend on the company’s field of activity, its size and the characteristics of the business. In some cases, a small excess will be enough, in others, own working capital must be above a certain level.
A negative value of own working capital (shortage) negatively affects the stable position of the company as a whole. In most cases, this leads to solvency problems. However, in some areas, the amount of working capital may be below zero, and this will be a normal situation.
Companies with a very fast operating cycle can afford a negative SOS value.
A case in point is fast food chains, which are able to turn inventory into cash in record time. Table 2. Causes of excess and deficiency
| Surplus | Flaws |
| SOS exceed the organization's inventories and costs. | SER is less than the value of inventory and expenses. |
| Part of the profit remains in circulation before it is distributed. | There is no profit left in turnover. |
Important! If a surplus occurs, it is advisable to store it in current accounts rather than keep it in inventory or pay additional expenses from working capital.
In the future, this money can be used to finance higher goals (for example, expansion of production).
Own working capital
Working capital is a category of management, defined as a set of circulating production (productive) funds and circulation funds in value (monetary) terms.
Working capital is generated from two main sources. These sources include own funds, that is, allocated to the enterprise during its formation and replenished in the future, and borrowed funds. The enterprise's need for the latter arises when its own sources become insufficient due to a discrepancy between the moment of shipment and the moment of payment for the goods at the enterprise.
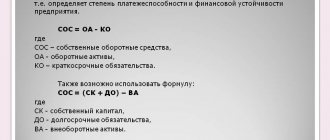
Own working capital (SOC), or working capital, is the amount by which an organization’s current assets exceed its short-term liabilities. This indicator is used to assess the ability of an enterprise to pay off short-term obligations by selling all its current assets.
Own working capital determines the degree of solvency and financial stability of the organization.
The sources of SOS are:
- authorized capital;
- the company's reserve fund;
- various financial funds;
- net profit;
- targeted financing and receipts from the budget and budgetary funds.
Own working capital is calculated using the formula:
COS = Current assets – Current liabilities
The same value can be obtained in another way:
SOS = (Equity + Long-term liabilities) - Non-current assets
Calculating SOS is one of the first steps in analyzing the financial condition of an enterprise.
Excess of own working capital can be used to increase it next year or withdrawn by a higher organization. The lack of own working capital is covered by deductions from profits, redistribution of working capital by a higher organization, a bank loan or appropriations from the budget.
Excess of own working capital is formed when:
- their value exceeds the sum of inventories and costs;
- Part of the excess profit remains in the enterprise’s turnover before it is distributed and used.
If you have a surplus of your own working capital, it is most advisable if it is in a bank account. Placing it in excess stocks of materials and equipment indicates the improper use of this surplus.
The excess of the availability of own and equivalent working capital over the total amount of standards shows an excess of own working capital. The excess of the total amount of standards over the availability of own and equivalent working capital characterizes the company's lack of own working capital.
The sufficiency of the enterprise's own working capital to finance current activities is shown by the coefficient of provision with its own working capital. This indicator is calculated using the following formula:
SOS supply ratio =
(Equity - Non-current assets) / Current assets
This ratio is not widespread in Western practice of financial analysis. In Russian practice, the coefficient was introduced normatively by the Order of the Federal Department for Insolvency (Bankruptcy) dated 08/12/1994 N 31-r and the now inactive Resolution of the Government of the Russian Federation of 05/20/1994 N 498 “On some measures to implement the legislation on insolvency (bankruptcy) of enterprises.” According to these documents, this coefficient is used as a sign of insolvency (bankruptcy) of the organization. According to these documents, the normal value of the equity ratio should be at least 0.1. It should be noted that this is a fairly strict criterion, characteristic only of the Russian practice of financial analysis; Most enterprises find it difficult to achieve the specified coefficient value.
Thus, the availability of own working capital, which can be used to acquire inventories, maintain work in progress and for other purposes to ensure the production, economic and commercial activities of the enterprise, is a necessary condition for the successful operation of the enterprise. Own working capital is intended to finance the current activities of the enterprise and characterize the amount of funds invested in current assets. In the absence of such funds, the company turns to borrowed sources.
SOS analysis
In itself, the indicator of own working capital does not contain any information. It must be analyzed in parallel with inventories as the least liquid assets and other sources of financing (amount of loans, etc.). What is important here is the ratio and its change in dynamics.
The goals of SOS analysis for the head of the company:
- identify the cost of the organization’s fixed working capital;
- determine the amount of surplus or deficit of SOS;
- identify a possible threat to solvency;
- establish how the situation has changed in dynamics.
You can understand whether the company has enough SOS using its own working capital ratio. This indicator is used to determine the insolvency (bankruptcy) of an enterprise.
conclusions
Having your own working capital is a prerequisite for a stable financial and economic position of an enterprise. This source is used to finance the material and technical base, replenish supplies, purchase patents and other resources. In the absence of this source, borrowed assets are used: short-term and long-term loans, borrowings, loans. For successful business operations, it is important that the SOS value is positive, that is, a surplus is formed, however, companies with a high turnover rate can afford to successfully operate with a negative SOS value (fast food, some types of services).
Standard value of the indicator of providing current assets with own funds:
Related materials
The standard value is 0.1 and above. A high value indicates the financial stability of the company and the ability to carry out active activities even in the absence of access to borrowed funds and external sources of financing for the company. Conversely, a value below the standard indicates the company’s significant financial dependence on external creditors. In a deteriorating market situation, the company will not be able to continue its activities. A negative value of the indicator indicates that all equity capital and long-term sources are aimed at financing non-current assets and the company does not have long-term funds to form its own working capital.