2020-03-13 24634
Indicators of the financial analysis of an enterprise allow us to determine its current state, opportunities and problems. This valuable information is then used to develop strategy and make management decisions. Investors, shareholders and business owners are also interested in it. Therefore, every company needs a specialist who, based on data from reports, can form adequate conclusions on the results of operations and forecasts. In the article we will consider the main groups of financial analysis ratios and learn how to correctly reveal their meaning.
Formation of indicators for analyzing the organization’s balance sheet
The balance sheet is the main reporting document of any organization. The composition of its indicators may vary from company to company, but the analysis is based on general principles and methods.
Analysis of the balance sheet is of practical importance if it is based on reliable information. To avoid its distortions (accidental or intentional), the enterprise must have an internal control system (Article 19 of the Law “On Accounting” dated December 6, 2011 No. 402-FZ). And to externally confirm the reliability of the balance sheet, an audit is used (clause 3 of the Law “On Auditing” dated December 30, 2008 No. 307-FZ). In some cases this is mandatory (Article 5 of Law No. 307-FZ). The list of companies subject to mandatory reporting audit can be found on the website of the Russian Ministry of Finance.
All mandatory accounting reports must meet the requirements for them: comparability, consistency, etc.
If you have access to ConsultantPlus, find out how to assess the solvency of a counterparty based on the balance sheet. If you don't have access, get a free trial of online legal access.
For more information about what requirements the balance sheet must meet, see the material “What requirements must accounting records satisfy? ”
Let's consider the main stages of the analysis of the balance sheet.
How to read a balance: simple rules of thumb
There is a balance for three months, six months and a year. To understand how an enterprise operated over a period of time, another form of reporting is used, which is called, in some ways more understandably, the “Profit and Loss Statement.” The balance sheet is a very natural balance between what a business has (its assets) and the sources of financing these assets come from (the business's liabilities or liabilities).
Assets are resources owned or controlled by a company that are expected to produce economic benefits (they are acquired by the company for this purpose, based on available resources). The asset sections and items of the balance sheet are based on how quickly the corresponding asset can be converted into money (liquidity principle). At the top of the balance sheet are the least liquid assets (fixed assets - they take a very long time to sell), then more liquid ones (inventories - often this is what is in the warehouse, i.e.
fairly quickly selling item)
Analysis of the financial condition of an organization using the example of an LLC: balance sheet formulas, calculation of indicators
Or you simply need to make sure that the new enterprise is financially stable and able to pay its obligations. It is not difficult to calculate financial indicators, but how to analyze them?
Indicators for analysis In order to analyze the financial condition of the enterprise, we need to calculate the following indicators:
- business activity of an enterprise is a property of the financial condition of an enterprise, which is characterized by indicators of turnover of current assets;
- solvency - determine the ability of your company to pay off its debts on time using revenue;
- liquidity - whether assets can be converted into cash or sold. The higher the degree of liquidity, the faster the company can find funds to cover its obligations.
- financial stability - the state of the enterprise’s finances, which creates all the conditions and prerequisites for its solvency;
For analysis, we need to know the dynamics of changes in indicators.
Analysis of the balance sheet using an example: preliminary stage
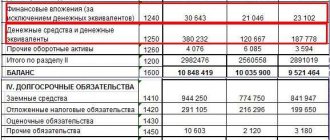
Let's consider an example of analyzing the balance sheet of an enterprise. The balance sheet of Sekunda LLC as of December 31, 2019 is as follows:
| Indicator name | Code | As of 12/31/2019 | As of 12/31/2018 | As of 12/31/2017 |
| ASSETS | ||||
| Fixed assets | 1150 | 320 | 250 | 200 |
| Reserves | 1210 | 205 | 160 | 115 |
| Accounts receivable | 1230 | 170 | 190 | 160 |
| Financial investments (excluding cash equivalents) | 1240 | 50 | 50 | — |
| Cash and cash equivalents | 1250 | 120 | 210 | 25 |
| BALANCE | 1600 | 865 | 860 | 500 |
| PASSIVE | ||||
| Authorized capital | 1310 | 10 | 10 | 10 |
| retained earnings | 1370 | 385 | 210 | 85 |
| Accounts payable | 1520 | 470 | 640 | 405 |
| BALANCE | 1700 | 865 | 860 | 500 |
The first reading of this report can be called introductory: the balance sheet figures assess the general structure of property and liabilities, the availability of raised funds, etc.
In this case, we are dealing with a developing company: an annual increase in the balance sheet currency, the appearance of financial investments in the asset structure, an increase in the cost of fixed assets (which may indicate the company’s intentions to invest in the development of its production potential), a steady decrease in debts - and all this without attracting long-term borrowed funds.
Preliminary conclusions have been made and we can proceed to a more detailed analysis. To do this, we will conduct a horizontal and vertical analysis of the balance sheet.
Analysis of the financial condition of the enterprise. Evaluation indicators
https://youtu.be/-nQ0-ZJMNlg
These are, first of all, inventories, deferred expenses, funds in settlements and temporarily free cash. The most active part of mobile funds is industrial inventories necessary to maintain production in a certain state .Future expenses - expenses for preparing and developing production, improving the organization of the production process. Funds in settlements - short-term debt for shipped products, as well as for goods, work, services. The current form of the balance sheet is a net balance. This means that depreciable assets are included in the total value of the enterprise's property at their residual value. In other words, all regulatory items are excluded from the gross balance sheet, such as depreciation of intangible assets, fixed assets, low-value and wearable items, and trade margins. Analysis of balance sheet liabilities (capital structure).
The liabilities side of the balance sheet reflects sources of capital, which can be own or borrowed.
Horizontal analysis of the balance sheet
Using horizontal analysis, we compare the balance sheet indicators by reporting dates (to simplify the example, we use data at the beginning and end of the reporting period):
| Balance sheet item | As of 12/31/2019 | As of 12/31/2018 | Deviation (+/–) | |
| sum | % | |||
| Property dynamics | ||||
| Including: non-current (OS) | 320 | 250 | +70 | +28,00 |
| negotiable | 545 | 610 | –65 | –10,65 |
| Reserves | 205 | 160 | +45 | +28,13 |
| Accounts receivable | 170 | 190 | -20 | –10,53 |
| Financial investments (excluding cash equivalents) | 50 | 50 | – | – |
| Cash and cash equivalents | 120 | 210 | -90 | –42,86 |
| Capital dynamics | ||||
| Including: equity | 395 | 220 | +175 | +79,55 |
| Authorized capital | 10 | 10 | – | – |
| retained earnings | 385 | 210 | +175 | 83,33 |
| borrowed capital | 470 | 640 | –170 | –26,56 |
| Sources of funds in calculations (accounts payable) | 470 | 640 | –170 | –26,56 |
A horizontal analysis of the balance sheet showed the following: during the reporting period, non-current assets increased by 28%, which may indicate the expansion of activities and growth of the company’s economic potential. At the same time, working capital decreased (by 10.65%) - mainly due to a decrease in cash balances (by 42.86%). There was an increase in working capital in inventories by 28.13%, which indicates a decrease in liquidity and may affect the solvency of the company. The presence of short-term financial investments in the current assets indicates a desire to invest funds in order to obtain additional profit. The growth of the balance sheet currency must also be compared with the rate of inflation and revenue growth.
Coefficients used for analysis
To assess a company from the point of view of its level of financial stability, various indicators play an important role, which are based on a comparison of the amount of funds owned by the organization with borrowed funds. Most often, the following coefficients are used to carry out such an analysis:
- The autonomy coefficient represents the share of capital owned by the organization in its total amount. This indicator allows you to assess the degree of dependence of the organization on its creditors. The value of the indicator is largely determined by the industry in which the company operates. The best value for the presented indicator is considered to be 0.6.
- Financial leverage is found as the ratio of borrowed funds to those owned by the company. This coefficient has a double meaning. On the one hand, its too high value shows a high degree of financial dependence, which is inevitably accompanied by high risks in the company’s activities. On the other hand, a complete refusal of borrowed funds, in which the value of the coefficient becomes equal to zero, does not allow obtaining higher profits.
- The indicator of provision with working capital owned by the company is the share of the company’s own capital in the total amount of current assets. If the company is stable, it should be at least 0.1. In the case when the value of the indicator is below this level, this indicates a low degree of sustainability, as well as investment unattractiveness.
- The level of investment coverage is calculated as the share of the amount of equity and liabilities, the maturity of which occurs no earlier than in 12 months, in the total capital. Normally, the coefficient size should be 0.7. The indicator allows us to assess how much a company is able to cover its own current debts with the help of its existing working capital.
- The maneuverability of a company's capital can be calculated as the ratio of the amount of working capital it owns to the size of its sources. The higher the value this ratio takes, the more financially stable the company can be considered. In addition, the indicator determines the degree of solvency.
- Capital mobility shows what percentage of the total value of all assets is working capital. How financially stable a company is is directly dependent on the size of this indicator.
- Mobility (also called maneuverability) of working capital can be calculated as the share of the maneuverable (that is, highly liquid) component of current assets in the total amount of working capital owned by the company. In this case, maneuverable working capital is calculated as the amount of cash in combination with financial investments.
- Another important indicator is inventory availability . It can be calculated by finding the ratio of working capital owned by the organization to the amount of inventories. Normally, the size of the indicator under consideration should be no less than 0.5.
- The short-term debt indicator characterizes the share of an organization's debts that are due in less than a year in total debt.
Determination of the structure of articles (vertical analysis) and the share of indicators
Using this type of balance sheet analysis, we examine the structure of indicators over time:
| Balance sheet item | As of 12/31/2019 | As of 12/31/2018 | Shifts in structure, % | ||
| sum | % to total | sum | % to total | ||
| Property structure | |||||
| Including: non-current assets (OC) | 320 | 36,99 | 250 | 29,07 | +7,92 |
| current assets | 545 | 63,01 | 610 | 70,93 | –7,92 |
| Reserves | 205 | 37,61 | 160 | 26,23 | +11,38 |
| Accounts receivable | 170 | 31,20 | 190 | 31,15 | +0,05 |
| Financial investments (excluding cash equivalents) | 50 | 9,17 | 50 | 9,17 | – |
| Cash and cash equivalents | 120 | 22,02 | 210 | 34,43 | -12,41 |
| Capital structure | |||||
| Including: equity | 395 | 45,66 | 220 | 25,58 | +2,02 |
| borrowed capital | 470 | 54,36 | 640 | 74,42 | – |
A vertical analysis of the balance sheet showed that during the reporting period there were no significant changes in the overall structure of property and capital.
The growth of non-current assets amounted to 7.92%. In the structure of current assets, small structural changes are observed in the lines “Cash and cash equivalents” (12.41%) and inventories (11.38%). An increase in working capital in inventories reduces their turnover, which may negatively affect current liquidity. The share of equity in the balance sheet currency amounted to 45.66% at the end of the period, mainly due to the share of retained earnings in equity (97.47%). There are no uncovered losses on the balance sheet.
The company does without long-term loans and borrowings, that is, the volume and structure of equity capital allows it to organize the production process and develop without external borrowings.
Groups of indicators for analyzing financial (accounting) statements
Liquidity indicators are indicators of the sustainability of an organization in the short term. They show whether the organization can easily pay off creditors, meet its debts, etc. within a year. If the indicator is lower than the norm, it means there is a higher risk that a dissatisfied creditor who has not received his money will file a lawsuit against the organization. In the worst case, this will lead to the initiation of bankruptcy proceedings for the enterprise.
The main liquidity indicators are: current liquidity indicator, quick liquidity indicator and absolute liquidity indicator.
The current liquidity ratio is the ratio of all current assets and all current liabilities:
Ptl = Current assets: Current liabilities
The value of the indicator demonstrates how much current assets the company has in order to pay off current liabilities. The standard value of the indicator depends on the industry, usually it is 1.2 and higher. A value below would indicate that the company may have difficulty paying off its obligations.
The quick liquidity ratio is the ratio of quick assets and current liabilities:
Pbl = (Current assets – Inventories): Current liabilities
This ratio is more conservative and does not take into account inventory, which is more difficult to convert into cash to pay off debts. Therefore, the indicator allows us to understand the solvency of the company over the next few months. A value of 0.9 or higher is considered standard.
The absolute liquidity indicator is the ratio of cash and current liabilities:
Pal = Cash and equivalents: Current liabilities
This ratio shows what part of the company's short-term liabilities is able to pay off immediately. The normative value is 0.1-0.2. Drawing up a payment calendar at an enterprise will allow you to control the value of the indicator and keep it within optimal limits based on the company’s needs for money.
An important group of indicators are indicators of financial stability. They make it possible to determine the medium-term prospects for the organization’s work, taking into account the financing structure. A larger share of equity capital leads to greater financial independence of the organization. As a result, the costs of attracting and using borrowed funds are reduced. In addition, financial risks are reduced. For example, all other things being equal, an organization with a larger amount of equity capital can attract more borrowed funds for the purchase of goods and raw materials, sales promotion, etc.
The ratio of provision of current assets with own funds shows what share of current assets the company is able to finance independently. The formula for calculation is as follows:
Posos = Own working capital: Current assets
A positive value of the indicator indicates the ability of the enterprise to carry out production and sales activities without interruption. Even reducing access to external financing will not stop the operational process. A low positive or negative value will indicate significant dependence on external sources, which creates some risks.
The indicator of financial autonomy is the ratio of the enterprise’s own finances and the total amount of liabilities:
PFA = Equity: Liabilities
This ratio indicates the share of assets that the company is able to finance on its own. The standard value depends on the industry, usually within the range of 0.4-0.6. A value that is too low indicates a high level of financial risks and possible bankruptcy if access to the capital market is limited, but a value that is too high will indicate incomplete use of the enterprise's potential.
Unlike the previous indicator, the financial stability ratio takes into account both permanent and long-term sources of financing. The formula for calculation is as follows:
KFU = (Equity + Long-term liabilities): Liabilities
Thus, the value will indicate the proportion of capital that will be available over a long period of time. A high value indicates a stable market position in the near future.
Rice. 1. Elements of analysis of financial statements (The list can be shortened for specific purposes of analysis)
Another group of indicators is profitability indicators. Profitability is not always the main goal of a commercial organization. For the current year, measures may be planned to increase the value of the organization, capture a larger part of the market, etc. But under normal conditions, it is these indicators that indicate the effectiveness of the commercial organization. Return on assets and equity in this case are criteria for the competence and professionalism of top management. Indicators are a consequence of the actions of competitors, market conditions, the state of fixed assets, customer loyalty, etc. That is, for most commercial organizations, profitability is the result of performance indicators.
Return on assets is an indicator that measures the ability of a company's assets to generate net profit. This ratio is the ratio of net profit and average annual assets.
RA = Net profit: Average annual assets * 100%
The regulatory value varies by industry. When conducting a profitability analysis, it is advisable to compare the coefficients of this group with the values of competitors. A higher value will indicate effective cost management, quality management, use of performance improvement reserves, etc.
Unlike return on assets, return on equity allows you to assess the attractiveness of owners investing their funds in the activities of the enterprise.
RSC = Net profit: Average annual amount of equity capital * 100%
To determine the standard value of the indicator, you should look at the profitability of alternative investment instruments, for example, investing in shares of other companies, opening a deposit account in a bank, etc. If the return on equity is higher, then management is effectively managing the owners’ funds.
Return on sales based on net profit or net margin approximately shows how much the net profit of an enterprise will increase if the level of sales increases by one ruble. The formula for calculation is as follows:
RPP = Net profit: Revenue * 100%
A higher value of the indicator also indicates effective cost management and high-quality control of the sales and production processes. It is worth noting that with a significant increase in sales levels, net profitability will increase, since the share of fixed costs in each ruble of sales will decrease.
Another group of indicators that should be considered in the process of financial analysis is indicators of business activity. If profitability is an indicator of the quality of the result, then business activity is an indicator of the quality of the work process. If an enterprise has a low turnover of accounts receivable for goods, it should reconsider its policy of commodity lending to customers. Low turnover of working capital, you should think about how to speed up the process. If the turnover period of products and goods is long, then it is necessary to reduce the size of their inventories or intensify the sales process by applying appropriate techniques. That is, this group of indicators allows the analyst to determine not only how the enterprise operates, but also where the problem is located.
Asset turnover shows the volume of production that was produced for each ruble of assets raised. For example, a value of 2.5 would indicate that for every ruble of assets, 2.5 rubles of products were produced and sold. The formula is as follows:
OA = Revenue : Average annual assets
A higher value of the indicator will indicate the ability of the enterprise to effectively manage a limited amount of resources.
High-quality inventory management will allow you to attract fewer financial resources, which saves money by reducing interest payable, warehouse rental costs, etc. Therefore, inventory management policy plays an important role in the implementation of financial activities. inventory turnover formula is as follows:
OZ = Cost: Average annual amount of inventory
Thus, inventory turnover is the ratio of cost and average annual inventory.
Another important aspect is accounts receivable . Basically, accounts receivable are formed in the process of commercial lending to customers (for example, deferred payment for delivered products or services). The formula for calculating turnover is as follows:
ARZ = Revenue: Average annual accounts receivable
Low turnover will indicate that clients are diverting funds from the enterprise, which leads to additional costs for attracting financial resources. The high turnover of accounts receivable allows you to free up some of the financial resources that can be used to intensify your own production activities.
A desirable stage in the analysis of financial statements is to assess the relative indicators of the property status. These indicators can suggest the features of a long-term policy for making financial investments, the role of fixed assets, show the share of financing that they divert to themselves, etc.
Of course, no less important are the indicators of the relative growth of the main elements of assets, liabilities and financial results during the study period. Using the data, you can find out whether the enterprise is at the stage of active development, degradation or stability. An increase in the cost of production assets leads to an increase in production potential, and an increase in the value of equity capital leads to an increase in the level of well-being of owners. A constant increase in income while maintaining stable prices indicates growing market power. Therefore, this group of indicators is also important.
Obviously, studying financial reporting data is not comparable to analyzing management reporting, but in conditions of limited information, this is the best way to get an idea of the state of the organization.
Analyzing the Balance Sheet Using Financial Ratios
By calculating special coefficients, further analysis of the balance sheet is carried out:
Solvency analysis
| Coefficient | Calculation | Recommended Range | |
| Formula | Sum | ||
| Financial dependency ratio. Read more about the coefficient in the article “Financial dependence coefficient (balance sheet formula)” | Balance sheet currency / equity | 865 / 395 = 2,2 | ≤2,0 |
| Financial independence ratio. Read more about the coefficient in the article “Financial independence coefficient (formula)” | Own capital / balance sheet currency | 395 / 865 = 0,46 | ≥0,5 |
| Total Solvency Ratio | Balance sheet currency / borrowed capital | 865 / 470 = 1,84 | ≥1,0 |
| Debt ratio | Debt capital/equity | 470 / 395 = 1,19 | ≤1,0 |
Liquidity analysis
| Coefficient | Calculation | Recommended Range | |
| Formula | Sum | ||
| Instant liquidity ratio | (DS and DE)*/ KO*** | 120 / 470 = 0,26 | >0,8 |
| Absolute liquidity ratio | (DS and DE + KFV**) / KO | (120+50) / 470 = 0,36 | >0,2 |
| Quick ratio | (DS and DE + KFV + DZ) / KO | (120 + 50 + 170) / 470 = 0,72 | ≥1,0 |
| Average liquidity ratio | (DS and DE + KFV + DZ + Reserves) / KO | (120 + 50 + 170 + 205) / 470 = 1,16 | >2,0 |
| Intermediate liquidity ratio | (DS and DE + KFV + DZ + Inventories + VAT) / KO | (120 + 50 + 170 + 205) / 470 = 1,16 | ≥1,0 |
| Current ratio | Current assets / KO | 545 / 470 = 1,16 | 1,5–2,0 |
* (DS and DE) - cash and cash equivalents.
** KFV - short-term financial. attachments.
*** KO - short-term liabilities.
For more information about liquidity ratios, read the article “Calculation of the liquidity ratio (balance sheet formula)” .
An analysis of the balance sheet using financial ratios showed that solvency indicators are close to the recommended ones. However, the instant, quick and current liquidity ratios show the insufficiency of working capital to repay short-term liabilities at the reporting date.
In addition, it is necessary to calculate financial stability coefficients (autonomy, agility, etc.).
Our articles will help you do this:
- “What does the autonomy coefficient show - the balance formula?”;
- “Agility coefficient (balance sheet formula)” and other materials in the “Analysis of Economic Activity (ABA)” .
Balance sheet liquidity
Balance sheet liquidity analysis means assessing a company's ability to sell its assets in order to pay off its liabilities. If money can be immediately used to pay off the most urgent obligations, then it is necessary to wait some time to sell inventories and turn them into money without loss of value.
Therefore, to determine the liquidity of the balance sheet structure, certain groups of assets should be compared with certain groups of liabilities.
Table 1 – Analysis of liquidity of the enterprise’s balance sheet
| Balance sheet asset | Ratio | Liability balance | Surplus/deficit |
| A4 (slowly-realized non-current assets: non-current assets of the enterprise) | А4<П4 | P1 (permanent sources of financing: capital and reserves) | P4-A4 |
| A3 (slow-selling current assets: inventories and VAT on acquired assets) | А3<П3 | P2 (long-term sources of financing: long-term liabilities) | P3-A3 |
| A2 (Quick assets: accounts receivable and other current assets) | А2<П2 | P3 (short-term sources of financing: short-term loans and borrowings) | P2-A2 |
| A1 (the most liquid assets: money, financial investments) | А1<П1 | P4 (most urgent liabilities: accounts payable) | P1-A1 |
As shown in the table, the following balance elements should be compared with each other:
1. The most urgent obligations with the most liquid assets. If the result is positive, then the company is able to urgently repay those obligations for which payment is due soon.
2. Quick assets and short-term sources of financing. If the sum of the fastest and most liquid assets exceeds the sum of all short-term liabilities, then the company will be able to meet its obligations on time within a year.
3. Slowly realized current assets and long-term liabilities. A positive cumulative result will indicate that the company is able to remain sustainable in the long term.
4. Non-current assets and equity. The company does not need to return equity capital in the foreseeable future if it operates efficiently, so this aspect does not influence conclusions about solvency.
Trend, factor and comparative analysis
In addition to the above stages of balance sheet analysis, trend, factor and comparative types of analysis can be carried out. They will complement and expand the volume of analytical data for making the necessary economic decisions.
Thanks to trend analysis, you can form an opinion about the main trend of changes in certain indicators (predictive analysis).
For example, a joint study of the dynamics of short-term debt and cash:
| Balance indicator | As of 12/31/2017 | As of 12/31/2018 | As of 12/31/2019 |
| Accounts payable | 405 | 640 | 470 |
| Cash and cash equivalents | 25 | 210 | 120 |
From the above figures it follows that, as of reporting dates, the nature of changes in the amount of short-term debts corresponds to changes in the volume of cash, but the company’s free cash is not enough to repay these debts.
Using factor analysis, the nature of the influence of the main factors on the change in the value of the indicator under study is determined. It is carried out according to a certain method of analyzing the balance sheet.
To carry out a comparative analysis, additional information is needed - the balance sheet data of one company is not enough. This is due to the fact that when carrying out this type of analysis, the balance sheet indicators of different companies are compared in order to determine their rating.
Specifics of analyzing the balance sheet of individual companies using the example of a bank balance sheet (Form 1)
Banks, although they are commercial companies and are created to make a profit, have specific features. They are subject to special legislation, maintain a special chart of accounts and build a different methodology for accounting processes.
At the same time, the main approaches to analyzing a bank’s balance sheet are in many ways similar to analyzing the balance sheet of an ordinary commercial company. For the bank balance sheet, the main stages of analysis also remain relevant:
- preliminary (reading the balance sheet, structuring its items, etc.),
- analytical (description of calculated indicators of structure, dynamics, relationship between balance sheet indicators);
- final (evaluation of analysis results).
In the process of analyzing the bank’s balance sheet, special coefficients are also calculated, but their types differ from those discussed earlier:
- bank reliability coefficient (capital adequacy ratio),
- return on assets ratio (shows the efficiency of using assets and quality based on their profitability),
- leverage ratio (interbank loans), etc.
To learn how banks analyze the creditworthiness of their clients, read the material “Methods for assessing the creditworthiness of commercial bank clients.”
Who needs the results of an analysis of a company's balance sheet?
Before diving headlong into a balance sheet analysis, it is necessary to find out why costs have increased, product quality has decreased, and what the manager should do to correct the situation.
The goal is to determine what past actions have influenced the firm's current economic position.
It is necessary to assess in advance what impact new decisions may have on the preservation of financial stability.
Analytical forecasts are in greater demand:
- banking organizations;
- contractors;
- supplier companies;
- by investors.
Decision making depends on:
- accuracy of reporting documents;
- quality of accounting work;
- internal control system;
- consistency of balance sheet data with information reflected in documents and accounting books;
- compliance of inventory data with balance sheet items;
- correct display of assets and liabilities on the balance sheet.
Before making calculations, you should make sure that the items included in the formulas and the order of reporting are uniform. The norms of PBU 1/98 are subject to decoding in the explanatory note.
The analysis should record currency changes in the balance sheet. Reading a balance sheet includes determining:
- the period for which the balance sheet was drawn up to compare similar indicators;
- principles of the enterprise's accounting policy;
- factors causing data changes;
- type of balance sheet - consolidated or related to a separate company;
- industry affiliation of the enterprise;
- dynamics of changes in the balance sheet currency and the main groups of items in liabilities and assets;
- evaluate all items of assets and liabilities, note emerging changes.
The final stage is to draw conclusions about the possibility of increasing capital.
Online program to facilitate the analysis process
Modern information processing tools can significantly simplify the process of comprehensive analysis of the balance sheet. Calculations are carried out both using standard computer programs (for example, using Excel, where you can carry out calculations, create tables and charts), and using specialized programs that allow you to conduct financial analysis online - via the Internet.
The use of specialized software not only saves time, but also significantly expands the types of analysis. They allow you to analyze market stability, business activity, score assessment of financial stability, etc. In addition, developers of specialized programs provide the possibility of adapting and changing the program depending on the goals and objectives of the analysis, taking into account the specifics of a particular enterprise.
An example of an analysis of the financial condition of an enterprise
Or you simply need to make sure that the new enterprise is financially stable and able to pay its obligations.
It is not difficult to calculate financial indicators, but how to analyze them? Indicators for analysis In order to analyze the financial condition of the enterprise, we need to calculate the following indicators:
- liquidity - whether assets can be converted into cash or sold. The higher the degree of liquidity, the faster the company can find funds to cover its obligations.
- solvency - determine the ability of your company to pay off its debts within the established time frame from revenues;
- business activity of an enterprise is a property of the financial condition of an enterprise, which is characterized by indicators of turnover of current assets;
- financial stability – the state of the enterprise’s finances, which creates all the conditions and prerequisites for its solvency;
For analysis, we need to know the dynamics of changes in indicators.
Results
Analysis of balance sheet indicators is a voluminous and multi-stage process. Its results make it possible to identify potential risks, develop the financial policy of the enterprise and contribute to effective management decisions. The analysis process can be facilitated by using specialized programs.
Sources:
- Federal Law of December 6, 2011 No. 402-FZ
- Federal Law of December 30, 2008 No. 307-FZ
You can find more complete information on the topic in ConsultantPlus. Full and free access to the system for 2 days.


