One of the characteristics of a stable position of an enterprise is its financial stability.
The following financial stability coefficients characterize independence for each element of the enterprise’s assets and for property as a whole, making it possible to measure whether the company is financially stable enough.
Autonomy coefficient
Financial dependency ratio
Debt to equity ratio
Maneuverability coefficient of own working capital
Ratio of mobile and immobilized assets
Working capital coverage ratio from own sources of financing
Own funds ratio
Inventory coverage ratio with own funds
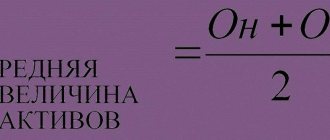
Capital preservation ratio
The simplest financial stability ratios characterize the relationship between assets and liabilities as a whole, without taking into account their structure. The most important indicator of this group is the coefficient of autonomy (or financial independence, or concentration of equity capital in assets).
The stable financial position of an enterprise is the result of skillful management of the entire set of production and economic factors that determine the results of the enterprise. Financial stability is determined both by the stability of the economic environment within which the enterprise operates, and by the results of its functioning, its active and effective response to changes in internal and external factors.
The main task of analyzing the financial stability of an enterprise is to assess the degree of independence from borrowed sources of financing. In the process of analysis, it is necessary to answer the questions: how independent is the company from a financial point of view, is the level of this independence increasing or decreasing, and whether the state of its assets and liabilities meets the objectives of its financial and economic activities.
In the classical theory of financial reporting analysis, financial stability is understood as such a ratio of assets and liabilities of an organization that guarantees a certain level of risk of insolvency of the organization. Thus, as indicators of financial stability, coefficients characterizing the structure of assets and liabilities of the balance sheet, as well as the relationship between individual items of assets and liabilities ( relative indicators of financial stability)
).
Autonomy coefficient (financial independence, concentration of equity capital in assets)
Characterizes the independence of the enterprise from borrowed funds and shows the share of its own funds in the total cost of all funds of the enterprise. The higher the value of this coefficient, the more financially sound, stable and more independent the enterprise is from external creditors:
Autonomy (independence) coefficient = Own capital / Assets
Ka = (p. 490 + p. 640 + p. 650) / p. 700 form No. 1
or
Ka = page 490 / page 700
According to the form of the balance sheet since 2011, the formula has the form: Ka = line 1300 / line 1600
The normative generally accepted value of the indicator is considered to be a value of the autonomy coefficient greater than 0.5 but not more than 0.7. But it is necessary to take into account that the independence coefficient significantly depends on industry specifics (the ratio of non-current and current assets). The higher the share of non-current assets of an enterprise (production requires a significant amount of fixed assets), the more long-term sources are needed to finance them, which means that the share of equity capital should be greater (the higher the autonomy coefficient).
Note that in international practice, the debt ratio (financial dependence coefficient) indicator is widespread, which is the opposite in meaning to the autonomy coefficient, but also characterizes the ratio of equity and borrowed capital. A fairly high level of independence coefficient in the USA and European countries is considered to be 0.5-0.6. At the same time, the amount of liabilities does not exceed the amount of own funds, which provides creditors with an acceptable level of risk. In Asian countries (Japan, South Korea), a value of 0.3 is considered sufficient. In the absence of justified standards, this indicator is assessed dynamically. A decreasing value indicates an increase in risk and a decrease in financial stability. Moreover, with an increase in the share of liabilities, not only does the risk of non-repayment increase, in addition, interest expenses increase, and the company’s dependence on possible changes in interest rates increases.
https://youtu.be/7DgYIdFMcYA
Standard value of the indicator of providing current assets with own funds:
Related materials
- Relative indicators of business activity (turnover)
- Accounts payable turnover ratio
- Inventory turnover ratio
- Working capital turnover ratio
- Asset turnover ratio
The standard value is 0.1 and above. A high value indicates the financial stability of the company and the ability to carry out active activities even in the absence of access to borrowed funds and external sources of financing for the company. Conversely, a value below the standard indicates the company’s significant financial dependence on external creditors. In a deteriorating market situation, the company will not be able to continue its activities. A negative value of the indicator indicates that all equity capital and long-term sources are aimed at financing non-current assets and the company does not have long-term funds to form its own working capital.
Financial dependency ratio
Financial dependence coefficient, characterizing dependence on external sources of financing (i.e., what share in the entire capital structure is borrowed funds). The indicator is widely used in the West. The indicator is defined as the ratio of total debt (sum of short-term liabilities and long-term liabilities) and total assets.
Financial dependence ratio = Liabilities / Assets
In accordance with the Order of the Ministry of Regional Development of the Russian Federation dated April 17, 2010 No. 173, the financial dependence coefficient is determined by the formula:
Kfz = (D0 + KO - Zu + Dbp + R) / P
where, Kfz - coefficient of financial dependence; D0 - long-term liabilities; KO - short-term liabilities; Zu - debt to the founders; Dbp - future income; P - reserves for future expenses; P - liabilities.
Kfz = (p. 590 + p. 690 - p. 630 - p. 640 - p. 650) / p. 700 f. No. 1
Kfz = (page 1400 + page 1500 - Zu - page 1530 - page 1540) / page 1700
Note that the line “Debt to participants (founders) for payment of income” (in the previous form - code 630) is excluded from the new form, since this debt is a payable and can be disclosed in the notes to the financial statements.
The recommended value of this coefficient should be less than 0.8. The optimal ratio is 0.5 (i.e. an equal ratio of equity and debt capital). If the indicator is less than 0.8, it means that liabilities should occupy less than 80% of the capital structure.
Value and conclusions based on the results of calculations
The equity ratio assesses the state of the organization in terms of its solvency.
If the value of the coefficient at the end of the reporting period is below 0.1, then the structure of the company’s balance sheet is unsatisfactory, and its condition is close to critical. In this case, the company requires a serious revision of the adopted strategy, urgent development of urgent measures to increase financial stability, and identification of negative factors that influenced the state of the organization. Sometimes radical measures are necessary, for example, a change in management or production profile, the introduction of external management (if the company is a branch of a parent organization), etc. In short, the calculation of the coefficient entails an in-depth analysis of the actual state of the enterprise’s finances, its solvency and effective measures to improve the situation .
Debt to equity ratio
This ratio provides the most general assessment of financial stability. Shows how many units of borrowed funds account for each unit of equity:
Debt to Equity Ratio = Debt Capital / Equity Capital
Kzs = (p. 590 + p. 690 - p. 640 - p. 650) / (p. 490 + p. 640 + p. 650) form No. 1
or
Kzs = (p.590 + p.690) / p.490
Kzs = (page 1500 + page 1400) / page 1300
Analyze the change in the value of the indicator over time. The growth of the indicator in dynamics indicates the increasing dependence of the enterprise on external investors and creditors. Recommended value of Kzs <0.7. The optimal ratio of borrowed and equity funds is 0.5 < Kzs < 0.7. Exceeding the coefficient value of 0.7, i.e. Kzc >0.7 indicates that the financial stability of the enterprise is in doubt.
The higher the value of the indicator, the higher the risk level of investors, since in case of failure to fulfill payment obligations, the possibility of bankruptcy increases.
Meaning
The study of the indicator value must be carried out over a period of at least three years.
During this time, it is possible to identify a trend that can be both positive and negative.
It should be taken into account that, unlike many relative indicators, this coefficient can take a value below 0.
Such a case does not happen often in practice and is typical for companies with financing problems.
Regulatory
It is worth noting that the indicator in question is used only in the Russian practice of financial analysis. The meter was introduced in 1994, and the main purpose of use was to determine insolvency.
The value of such an indicator should not be less than the established norm of 0.1.
However, such a strict criterion is unattainable for many companies. In this context, it seems particularly relevant to analyze the indicator over time to identify its own trend of change.
If increased
An increase in the indicator is a positive signal for the overall financial stability and solvency of the company.
This positive trend is associated with many factors, some of them:
- with a reduction in the credit burden;
- with an increase in the share of equity capital;
- with improved solvency indicators;
- with an increase in the number of clients.
If it decreases
If the value of the indicator is significantly lower than the norm or has a negative trend, then we are talking about a decrease in the stability of the enterprise and an increase in dependence on credit resources.
This negative trend is reflected in the following aspects:
- reduction of equity capital;
- increasing the level of risk of loss of financial stability;
- increasing the level of risk of loan delinquency.
If negative
In practice, there are cases when the value of the indicator becomes less than 0.
This situation indicates the company’s inability to finance its current activities with its own funds, even partially.
The economic activity of such an enterprise is carried out only through borrowed sources, which indicates an unstable situation and can lead to bankruptcy.
What does the quick ratio show? Details and calculation examples are in our material. What is the working capital turnover ratio? Information here.
What are the deadlines for paying wages? Read here.
Possible reasons for the change
Any fluctuations in a company's financial performance are associated with many factors.
Changes in the ratio under consideration are primarily related to the quality of the company's financial and credit policies.
So, the indicator can be influenced to a greater extent by:
- the level of dependence of the company on creditors;
- stage of the company's life cycle;
- market situation;
- belonging to the industry.
It is also necessary to take into account environmental factors that can, to one degree or another, influence the financial position of the company.
How to improve?
Improvement of the indicator can be achieved through:
- optimization of the structure of current assets and borrowed funds;
- directing net profit into the current activities of the company;
- attracting new funds from owners;
- reduction of the production cycle;
- increasing sales volume.
To determine the most effective direction of development for a particular company, a comprehensive analysis is required, which involves a multifactorial study.
Identifying problems and contradictions in the functioning of an object both within itself and in relation to the external environment allows you to respond to changes in a timely manner.
Thus, we can conclude that in conditions of high volatility in the macro environment, companies need continuous adaptation.
In this context, the use of the considered analytical tools makes it possible to timely identify negative trends.
https://youtu.be/v3aVaUY9MUo
Attention!
- Due to frequent changes in legislation, information sometimes becomes outdated faster than we can update it on the website.
- All cases are very individual and depend on many factors. Basic information does not guarantee a solution to your specific problems.
That's why FREE expert consultants work for you around the clock!
- via the form (below), or via online chat
- Call the hotline:
- Moscow and the Region
- St. Petersburg and region
- Regions - 8 (800) 222-69-48
APPLICATIONS AND CALLS ARE ACCEPTED 24/7 and 7 days a week.
Analysis of economic activities
Ratio of mobile and immobilized assets
Shows how many non-current assets account for each ruble of current assets:
Ratio of mobile and immobilized assets = Current assets / Non-current assets
Km/i = (page 190 + page 230) / (page 290 - page 244 - page 252) form No. 1
or
Km/i = page 190 / page 290
Km/i = page 1100 / page 1200
No standard values have been established for this indicator.
Economic meaning of the indicator and formula
The ratio of supply of inventories and costs reflects the part of inventories and costs that are purchased from own sources. The indicator is found by dividing the amount of equity by the valuation of inventories and costs.
The traditional formula looks like this:
Kozss = own working capital/inventories.
The indicator in the numerator is also called “working capital”. This value reflects how much current assets exceed the company's short-term liabilities. Own working capital shows the company's ability to pay off short-term obligations after selling its current assets. That is, “working capital” is an indicator of the solvency and financial stability of an enterprise.
Own working capital is the difference between mobile assets and short-term accounts payable. If we describe the components of “working capital”, then the calculation of the equity ratio will look somewhat different.
Formula:
Kozss = (OA - KO) / inventories and costs.
- OA – current assets,
- KO – short-term liabilities.
There is another way to calculate the value in the numerator. Then the formula for the ratio of inventory coverage with own sources of financing will look like this:
Kozss = ((SK + DO) – Vob.A)) / inventories and costs.
- SK – equity capital,
- DO – long-term liabilities,
- Vob.A – non-current assets.
In financial practice, various variations of the calculation formula are used. In particular, the composition of own working capital includes debt to the founders for the payment of dividends, future income, and reserves for future payments. The amount of inventory can be supplemented by advances to suppliers and work in progress.
Working capital coverage ratio from own sources of financing
The ratio shows whether the enterprise has its own funds necessary for its financial stability:
Working capital coverage ratio with own sources of financing = (Equity capital - Non-current assets) / Current assets
Ko = (p. 490 - p. 190)/(p. 290 - p. 230) form No. 1
Ko = (p. 1300 - p. 1100) / p. 1200
The methodological literature indicates that the enterprise is provided with its own sources of working capital financing with a coefficient value of ≥0.1.
Calculation example
To better understand the principle of analyzing your own resources in circulation, it is necessary to consider the calculation using an example.
The provision of own working capital is determined according to the balance sheet at the end of the operating period.
For example, this year an enterprise’s equity capital increased from 260 to 280 thousand rubles. Non-current assets also increased from 150 to 170 thousand rubles, and current assets - from 250 to 275 thousand rubles. The coefficient at the beginning of the period is equal to:
At the end of the reporting period the indicator was:
We can come to the conclusion that the supply ratio in the period under study complied with the standard. This indicates good financial stability of the company.
Own funds ratio
The coefficient of provision with own working capital shows the sufficiency of the enterprise's own funds necessary to finance current (operating) activities, i.e. ensuring financial stability. This indicator was introduced normatively by the Order of the Federal Fund for Financial Affairs of August 12, 1994 No. 31-r, and is not widespread in Western practice of financial analysis.
The formula for calculating the working capital ratio is as follows:
Equity ratio = (Equity capital - Non-current assets) / Current assets
Xos = (p. 490 - p. 190) / p. 290 form No. 1
Xos = (p. 1300 - p. 1100) / p. 1200
According to the above order, the indicator is used as a sign of insolvency (bankruptcy) of the enterprise. The normal value of the equity ratio should be at least 0.1.
General meaning
Own working capital (SOC) is an absolute value. They show how many financial resources from free sources of formation were put into circulation. After all, borrowed capital in the total assets of the company should not exceed a certain level.
If operating activities are carried out only through paid sources of financing, this indicates the organization’s inability to pay off its obligations in the current period.
This, in turn, significantly reduces liquidity and financial stability indicators. The company operates at a loss, because at the end of the operating period, net profit will go to pay interest for the use of creditors' capital. And sometimes it is simply not enough to pay off the debt.
Therefore, own working capital must have a positive value. If the number is negative, the company has a shortage.
Inventory coverage ratio with own funds
The coefficient of provision of material inventories with own funds is an indicator characterizing the level of financing of inventories from the enterprise’s own sources (funds).
The formula for calculating the coefficient is:
Inventory coverage ratio with own funds = Own working capital / Inventories
Goats = (p. 490 + p. 590 - p. 190) / p. 210
Goats = (p. 1300 + p. 1400 - p. 1100) / p. 1210
In practice, there is a modified method for calculating this indicator; inventories are supplemented by costs (costs in construction in progress and advances to suppliers and contractors). In this case, the formula for calculating the ratio of supply of inventories and costs with own working capital will take the form:
Goats = (Equity + Long-term liabilities - Non-current assets) / (Inventories + Work in progress costs + Advances to suppliers and contractors)
The standard value of the coefficient lies in the range from 0.6 to 0.8, i.e. the formation of 60-80% of the enterprise's reserves should be carried out at its own expense. The higher the value of the indicator, the less dependence of the enterprise on borrowed capital in terms of the formation of reserves and, consequently, the higher the financial stability of the organization.
Examples of coefficient calculation
An example of calculating a forecast for changes in the solvency of an enterprise
A toy shop
Own capital = 500,000 rub. This includes the owner's investments and income from trading operations.
Non-current assets = 300,000 rub. This includes the cost of display cases, cash registers, and other retail equipment.
Current assets = 250,000 rub. They consist of goods located in the store and warehouse, and cash balances in the cash register.
K = (500,000 - 300,000)/250,000 = 0.8
0.5< K < 1, therefore, the toy store is financially stable. It can easily generate working capital using existing operating income and its own funds. Even if sales decline for some time, the organization will be able to replenish working capital from its own sources of financing
Web design studio
Own capital = 120,000 rubles. This includes investments from owners and income from completed orders.
Non-current assets = 90,000 rub. This includes the cost of computers and related equipment.
Current assets = 450,000 rub. This includes receivables for completed orders and funds in the company's current account.
K =0)/450,000 = 0.066
K<0.1, therefore, the company does not have financial stability. This means that if, for example, customers do not pay accounts receivable or other problems arise with replenishing working capital, the company will not be able to cover cash needs from its own funds. She may have to take out a loan or resort to other sources of debt financing. In any case, the web studio may not be able to fulfill its financial obligations, for example, paying salaries to programmers.
Repair team
Own capital = 1,100,000 rub. It includes investments by owners and income from work performed. Non-current assets = RUB 900,000. This includes repair equipment, special clothing, and a vehicle, which is included in the cost of the brigade. Current assets = 680,000 rub. These include construction materials and consumables for repair equipment.
K = (1,100,000 - 900,000)/680,000 = 0.29
0.1< K < 0.5. In this case, the coefficient is below the optimal value of 0.5. Consequently, in the event of financial turmoil, the company may not be able to cover the need for working capital from its own sources. Given the resource-intensive nature of the repair business, cash gaps may arise.
SOS calculation
Each enterprise calculates the absolute value of its own resources in circulation. Based on this indicator, you can come to a conclusion about the structure of the balance sheet, and, if necessary, optimize it. Provision of own working capital is determined as follows:
SOS = Assets in circulation - Short-term liabilities
Based on balance sheet data, the formula looks like this:
SOS = s. 1200 - p. 1500
This is the approach officially adopted by the “Methodological Regulations for Assessing Financial Condition”. But, based on the economic meaning of the balance sheet structure, this formula can be presented in a different form:
SOS = Own capital + Long-term liabilities – Non-current assets.
According to the balance sheet, the calculation looks like this:
SOS = s. 1300 + s. 1530 - p. 1100
The first formula is simpler for calculations, so it is most often used. But in order to understand the organization of the balance sheet structure, it is necessary to understand the essence of the second calculation.
Why is it necessary to calculate KOSOS?
The value of the coefficient is of interest to economists and business managers. It will provide answers to the following questions:
- Is there a shortage of working capital?
- Is leverage dragging down your business?
- Does the company have its own funds to support its activities?
- Is everything in order with the company's solvency?
- Is the balance sheet structure satisfactory?
- Is there a danger of bankruptcy in the foreseeable future?
- Is working capital management effective?
- Will the company be able to operate if problems arise with attracting loans and borrowings?
Regular analysis of the ratio over time allows you to identify possible problems with liquidity, solvency and financial stability and take timely measures to improve the situation.