What does return on assets show?
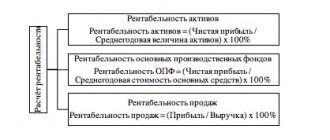
Profitability is a whole system of indicators that characterize the efficiency of an enterprise. One such indicator is the return on assets ratio. It is usually denoted by ROA (short for return on assets).
This coefficient demonstrates how high the return on funds invested in the organization’s property is, what profit each ruble invested in its assets brings to the company.
In general, the formula for calculating return on assets can be presented as follows:
ROA = Pr / Ak × 100%,
Where:
ROA - return on assets;
Pr - profit (for calculation, either net profit or profit from sales is taken, depending on what profitability the user is interested in);
Ak - assets of the organization (as a rule, the average value of assets for the period is used for calculation).
Return on assets is a relative indicator, usually expressed as a percentage.
RONA ratio
RONA is a measure of the return on net assets ratio. Through calculation, it is possible to establish the correct use of invested capital and the receipt of large income from the invested funds by its owners.
Net assets are the total cost unit (the value of property), excluding amounts for the payment of any debts. Or, in other words, this is the profitability ratio of current and non-current financial assets.
All company owners are interested in increasing this value. Net profit directly indicates the feasibility of investing capital in a given organization, and also shows the value of dividend payments and is reflected in the total cost.
The RONA calculation is similar to the ROA calculation. There is a slight difference - the institution’s capital expenses should not be taken into account. This ratio is an indicator of the degree of performance in the financial market.
RONA shows financial group managers that there is an investment in acquiring and maintaining the property. The basis for calculation is annual profit after payment of all taxes.
back to menu ↑
https://youtu.be/KcpSVzFTgMQ
How to calculate the profitability of non-current assets (balance sheet formula)
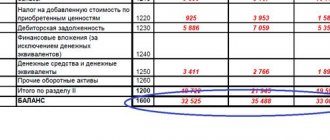
Non-current assets are the so-called long-term assets that the company uses for a long time - more than 12 months. Such property is reflected in section I of the balance sheet. These are fixed assets, intangible assets, long-term financial investments, etc.
When calculating the profitability of assets of this category, the denominator needs to reflect the total for section I - line 1100. Then we will get the profitability of all existing non-current assets.
If necessary, you can analyze the profitability of a particular type of asset, for example, fixed assets or a group of non-current assets (tangible, intangible, financial). In this case, the data on the lines that reflect the corresponding property is substituted into the formula.
The easiest way to calculate the average value of assets is to add the indicators at the beginning and end of the year and divide the sum by 2.
For more information about the balance sheet, see “Filling out Form 1 of the balance sheet (sample)” .
The profit indicators for the numerator of the return on assets formula must be taken from the financial results statement, known to everyone as Form 2:
- profit from sales - from line 2200;
- net profit - from line 2400.
About Form 2, read: “Filling out Form 2 of the balance sheet (sample)” .
“Non-current assets” - what is it?
Before we look at how to calculate the profitability of non-current assets and interpret the resulting value, we will explain what is meant by the concept of non-current assets. It is well known that there are two types of enterprise assets: current and non-current.
Non-current resources include all the company's resources that are used in business for a long time (more than 12 months), and their cost is included in the production of products in parts. Their opposite - working resources - are used for 1 year, ensure the continuous nature of management and actually provide the composition of manufactured products (for example, raw materials).
Non-current assets are conventionally divided into two categories: tangible (material) and intangible. The first includes: land, buildings and structures, all equipment, including trade and cash register equipment, transport, furniture, computers and office equipment, breeding animals and perennial plants, archival and library funds.
Among the intangibles are: information databases, enterprise software, property rights, licenses and various patents, as well as trademarks. Interestingly, some economists even classify a company's reputation as an intangible asset. Financial assets are considered a separate category of assets.
In any case, all assets that are not expressed in tangible form, but are important for the operation of the enterprise, helping to create products over time and make a profit from them, should be classified as intangible non-current assets.
Why does an accountant need return on assets?
It is generally accepted that, for the most part, the return on assets indicator is of interest to financiers and analysts who assess business performance and look for growth reserves. However, it is also important for accountants or tax specialists of companies. The fact is that profitability, including return on assets, is one of the criteria for assessing the risk of falling into the tax audit plan provided for by Order of the Federal Tax Service of Russia dated May 30, 2007 No. MM-3-06/ [email protected] A critical deviation is considered to be a deviation in profitability the organization's assets from the industry average by 10% or more.
Return on assets in the main areas of activity since 2006 is given in Appendix 4 to the order of the Federal Tax Service of Russia dated May 30, 2007 No. MM-3-06/ [email protected] Calculate your return on assets and compare it with the industry average. What if you are already under control? You can view the industry average profitability (download Appendix 4 to the order of the Federal Tax Service of Russia dated May 30, 2007 No. MM-3-06 / [email protected] ) on the tax service website.
Why know the content of concepts for calculation
In the previous section, we examined in detail the meaning and examples of the concept of “non-current assets”. But why dwell in such detail on the meaning of this term? The point is that in order to correctly calculate the profitability of non-current assets, it is important to initially correctly formulate a list of data for calculation.
Now you know that to determine such a coefficient, you need to take into account not only the cost of land and equipment, but also software, as well as intellectual property. This way, the results of the calculation and subsequent analysis will be more accurate.
Results
Calculation of profitability is necessary both for assessing the effectiveness of investments and for planning interaction with tax authorities. If profitability indicators deviate from the industry average by 10% or more downwards, this means that the organization is at risk and can be included in the on-site tax audit plan.
Read about the calculation of other profitability indicators in the following articles:
- “The procedure for calculating the profitability of an enterprise (formula)”;
- “How to calculate product profitability?”;
- “Determining return on equity (formula).”
You can find more complete information on the topic in ConsultantPlus. Full and free access to the system for 2 days.
Formula for calculation
In general, return on assets (ROA) is calculated using one of these formulas:
ROA=(PR/Asp)*100%
or
ROA=(PP/ASR)*100%,
where PR is the profit received from sales, PE is the net profit of the enterprise, ACP is the value of assets on an average annual basis.
It is clear from the formula that the calculated parameter is relative and is always expressed as a percentage. The coefficient clearly demonstrates how many kopecks of net profit (profit from sales) will accrue for each ruble invested in the organization’s funds.
For those who want to clearly see how these formulas work, we suggest watching the video:
The value of profit from sales can be found out in two ways: taken from the official statement of financial profits and losses, or calculated independently using the following formula:
PR=TR-TC,
where TR (abbreviation for totalrevenue) is the organization’s revenue in value terms, TC (totalcost) is the total cost.
The TR value, in turn, is calculated using the formula:
TR=P*Q,
where P (price) is the price, and Q (quantity) is the sales volume.
The vehicle value represents the total costs of the company, including components, materials, depreciation, wages, communications costs, security, utilities, and other costs.
The value of NP (net profit) can also be obtained from the income statement. Also, this value can be calculated using the formula:
PP=TR-TC-Pr+PrD-N,
where PrP and PrD are the values of other expenses and income, respectively (this includes any costs or income not related to the main activity of the organization), N is the indicator of accrued taxes.
The value of assets can be found in the organization's balance sheet.
An example of calculating the profitability of current assets of JSOC Bashneft according to RAS
To assess the dynamics of profitability, let’s consider 3 reports published on the official website of JSOC Bashneft based on data published for 2020, 2020, 2013.
| Indicator, thousand rubles. | 2017 | 2016 | 2015 | 2014 | 2013 | 2012 | 2011 |
| Page 2400, thousand rubles. | 129325054 | 43260638 | 52306523 | 65272010 | 69124363 | 45175078 | |
| Page 1200, thousand rubles. | 255700512 | 136558537 | 111534286 | 163972449 | 156435927 | 151301036 | 125729842 |
| Profitability = Page 2400 / Page 1200,% | 65,94 | 34,87 | 37,97 | 40,74 | 44,92 | 32,61 |
Based on calculations, for clarity, a graph of the dynamics of nominal indicators of profit and current assets is constructed
Picture 1
Dynamics of net profit and current assets of JSOC Bashneft according to RAS 2012-2017, thousand rubles.
Also important is the visual reflection of the dynamics of profitability of current assets.
Figure 2
Dynamics of profitability indicators for current assets of JSOC Bashneft according to RAS 2012-2017, %
Based on calculated and graphical data according to RAS, it is possible to characterize the dynamics of the profitability of current assets and directly the indicators themselves of the dynamics of net profit and the size of current assets. The standard indicator for manufacturing enterprises is 0.2%; in the case under consideration, the calculated profitability indicator of JSOC Bashneft is significantly higher. The indicator is not stable, because working capital has the property of high liquidity, so the main condition for this indicator is that it does not decrease below 0%.
The procedure for calculating the profitability of current assets according to IFRS
To calculate profitability under IFRS, data is taken from the companies' consolidated statements. According to IFRS, current assets include:
- Cash and cash equivalents
- Other current financial assets
- Accounts receivable
- Debt
- Inventory
- Advances issued and other current assets
According to IFRS, the formula will be presented:
Return on current assets = net profit after taxes / average current assets
Cost return ratio
The cost return ratio shows the ratio of profit before tax to the total cost of production and sales of products. The calculation formula is as follows:
Cost return ratio = Profit before tax / Total cost of goods sold Cost return ratio = p. 140 Form No. 2 / (p. 20 Form No. 2 + p. 30 Form No. 2 + p. 40 Form No. 2)
You can find out more about enterprise profitability ratios in the article: “Profitability ratios. 14 types. Calculation formulas."
Author: Ph.D. Zhdanov I.Yu.
Return on equity ratio (ROE)
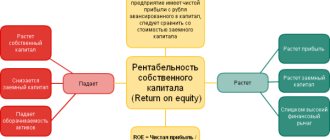
Foreign abbreviation ROE – Return on shareholders' equity. This indicator characterizes how much net profit falls on the enterprise’s capital, which includes both its own and borrowed capital. The return on equity ratio allows you to compare different investment options according to the degree of profitability, for example, investments in the authorized capital of an enterprise, investments in deposits, shares, bonds, real estate, etc. The formula for calculating the return on equity ratio is as follows:
Return on equity ratio (ROE) = Net profit / Average equity capital ROE = line 190 Form No. 2 / (0.5*(line 490 at the beginning of the year + line 490 at the end of the year))
Return on Investment (ROI) Ratio
investment ratio - ROI shows the profitability of an enterprise when using debt and equity capital. Another name for the return on investment ratio is the return on constant capital ratio. This indicator reflects the competitiveness of an enterprise to generate profit in a market economy.
Return on investment = Net profit / Own capital + Long-term liabilities ROI = line 190 Form No. 2 / (line 490 + line 590)
An example of calculating the profitability of current assets of JSOC Bashneft according to IFRS
To assess the dynamics of profitability, let’s consider 3 consolidated reports published on the official website of JSOC Bashneft based on data published for 2020, 2020, 2013.
| Indicator, thousand rubles. | 2017 | 2016 | 2015 | 2014 | 2013 | 2012 | 2011 |
| Net profit, thousand rubles. | 141857 | 52027 | 59564 | 42996 | 46436 | 56570 | |
| Current assets, thousand rubles. | 256002 | 124334 | 100605 | 135375 | 102413 | 121612 | 137438 |
| Profitability, % | 74,59 | 46,26 | 50,48 | 36,16 | 41,46 | 43,67 |
Based on the calculations, a dynamics graph is generated for clarity
Figure 3
Dynamics of net profit and current assets of JSOC Bashneft according to IFRS 2012-2017, thousand rubles.
Also important is the visual reflection of the dynamics of return on equity
Figure 4
Dynamics of profitability indicators for current assets of JSOC Bashneft according to IFRS 2012-2017, %
Based on the obtained calculation and graphical data according to IFRS, the dynamics of net profit indicators and the size of working capital are visible. The indicator standards must be more than 0%. Thus, this profitability indicator of JSOC Bashneft has never dropped to 0% over the past 6 years.
It is clear that the values calculated on the basis of different types of reporting differ due to different reporting methods. IFRS is more aimed at users of reporting represented by investors, and RAS is focused on formalization in accordance with accepted standards.
Calculation of profitability of current assets
The profitability indicator plays an important role for investors and the higher the indicator, the more efficiently the funds invested by investors work.
To calculate profitability, the following forms of financial statements are taken as a basis:
- balance sheet
- income statement
Return on current assets = line 2400 (form 2) / average value line 1200 (form 1)
Dynamic indicators over a number of years are used for analysis. In accordance with the Law “On Joint Stock Companies”, financial statements must be published in the media within 2 days from the date of submission or preparation.

