Every enterprise, firm or organization aims to make a profit. It is profit that makes it possible to pursue an investment policy in one’s own working and non-current assets, to develop production capacity and innovativeness of products. In order to assess the direction of development of an enterprise, reference points are needed.
Such guidelines in financial terms and financial policy are financial stability ratios. Definition of financial stability Financial stability is the degree of solvency (creditworthiness) of the enterprise, or the share of the overall stability of the enterprise, which determines the availability of funds to maintain the stable and efficient operation of the enterprise. Assessing financial stability is an important stage in the financial analysis of an enterprise, because it shows the degree of independence of the enterprise from its debts and obligations.
Types of financial stability ratios
The first coefficient characterizing the financial stability of an enterprise is the financial stability coefficient , which determines the dynamics of changes in the state of the enterprise’s financial resources in relation to how much the total budget of the enterprise can cover the costs of the production process and other goals. The following types of coefficients (indicators) of financial stability can be distinguished:
- Financial dependence indicator;
- Indicator of concentration of equity capital;
- Indicator of the ratio of own and borrowed funds;
- Indicator of maneuverability of equity capital;
- Indicator of the structure of long-term investments;
- Indicator of debt capital concentration;
- Indicator of debt capital structure;
- Indicator of long-term borrowing.
The financial stability coefficient determines the success of the enterprise, because its value characterizes how much the enterprise (organization) depends on borrowed funds from creditors and investors and the ability of the enterprise to fulfill its obligations in a timely manner and in full. High dependence on borrowed funds can hinder the activities of an enterprise in the event of an unplanned payment.
How to achieve financial independence
It is possible to achieve complete financial independence using only the company’s internal reserves.
https://youtu.be/lb-xxT0qpqU
However, this approach has many significant disadvantages, including:
- development slowdown;
- loss of huge additional profits;
- inability to attract additional capital to expand the business;
- decreased investor interest;
- difficulties in raising funds for promising projects.
If the autonomy indicator is around the one mark, this means negative growth dynamics. The owners of the organization deliberately refused additional investment and keep the business in a state of stagnation.
For the successful development of projects in any field of activity, it is better to have an autonomy indicator of 0.6-0.7. This FSC allows you to attract additional investments and not be afraid of crisis situations.
If the level of autonomy is low, prompt action should be taken to review and optimize the structure of equity capital. In case of serious violations of solvency, it makes sense for the company's owners to raise additional funds from shareholders or attract an external investor.
If a low FIT does not interfere with the solvency of the organization, then it can be increased by investing future profits in the authorized capital of the company.
To improve the KFN it is necessary to perform a number of actions:
- Change the balance sheet structure. Transferring part of your earnings into the company’s capital will help you achieve a stable level of autonomy. Ideal options for increasing capital are: additional issue of shares, sale of part of unused equipment and closing of debts to creditors.
- Reduce costs. Reducing current expenses allows you to achieve a normal indicator of the organization’s financial independence.
- Identify the reasons for the decline in solvency. The most common reasons for the deterioration of the financial capital are considered to be large inventories, unsold goods or equipment that has not gone through the full production cycle.
Practice shows that the best way to improve financial stability is personal connections with credit institutions.
Financial dependency ratios
The financial dependence ratio is a type of financial stability ratio of an enterprise and shows the degree to which its assets are secured by borrowed funds. A large share of asset financing using borrowed funds shows the low solvency of the enterprise and low financial stability. This, in turn, already affects the quality of relationships with partners and financial institutions (banks). Another name for the coefficient of financial dependence (independence) is the coefficient of autonomy (in more detail).
The large importance of equity in the assets of the enterprise is also not an indicator of success. The profitability of a business is higher when, in addition to its own funds, the company also uses borrowed funds. The task is to determine the optimal ratio of own and borrowed funds for effective functioning. The formula for calculating the financial dependence ratio is as follows:
Financial dependence ratio = Balance sheet currency / Equity capital
https://youtu.be/LwWP2wLk0Iw
Autonomy coefficient (financial independence, concentration of equity capital in assets)
Characterizes the independence of the enterprise from borrowed funds and shows the share of its own funds in the total cost of all funds of the enterprise. The higher the value of this coefficient, the more financially sound, stable and more independent the enterprise is from external creditors:
Autonomy (independence) coefficient = Own capital / Assets
Ka = (p. 490 + p. 640 + p. 650) / p. 700 form No. 1
or
Ka = page 490 / page 700
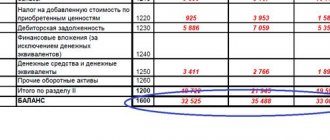
According to the form of the balance sheet since 2011, the formula has the form: Ka = line 1300 / line 1600
The normative generally accepted value of the indicator is considered to be a value of the autonomy coefficient greater than 0.5 but not more than 0.7. But it is necessary to take into account that the independence coefficient significantly depends on industry specifics (the ratio of non-current and current assets). The higher the share of non-current assets of an enterprise (production requires a significant amount of fixed assets), the more long-term sources are needed to finance them, which means that the share of equity capital should be greater (the higher the autonomy coefficient).
Note that in international practice, the debt ratio (financial dependence coefficient) indicator is widespread, which is the opposite in meaning to the autonomy coefficient, but also characterizes the ratio of equity and borrowed capital. A fairly high level of independence coefficient in the USA and European countries is considered to be 0.5-0.6. At the same time, the amount of liabilities does not exceed the amount of own funds, which provides creditors with an acceptable level of risk. In Asian countries (Japan, South Korea), a value of 0.3 is considered sufficient. In the absence of justified standards, this indicator is assessed dynamically. A decreasing value indicates an increase in risk and a decrease in financial stability. Moreover, with an increase in the share of liabilities, not only does the risk of non-repayment increase, in addition, interest expenses increase, and the company’s dependence on possible changes in interest rates increases.
Debt to equity ratio
This financial stability ratio shows the ratio of the company's own and borrowed funds. If this ratio exceeds 1, then the enterprise is considered independent of borrowed funds from creditors and investors. If it is less, it is considered dependent. It is also necessary to consider the rate of turnover of working capital, so in addition it is useful to also consider the rate of turnover of accounts receivable and the rate of material working capital. If accounts receivable turn over faster than working capital, this indicates a high intensity of cash flow into the organization. The formula for calculating this indicator:
Debt to equity ratio = Own funds / Borrowed capital of the enterprise
Own funds ratio
The coefficient of provision with own working capital shows the sufficiency of the enterprise's own funds necessary to finance current (operating) activities, i.e. ensuring financial stability. This indicator was introduced normatively by the Order of the Federal Fund for Financial Affairs of August 12, 1994 No. 31-r, and is not widespread in Western practice of financial analysis.
The formula for calculating the working capital ratio is as follows:
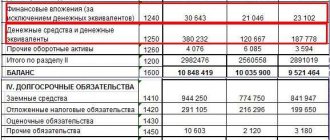
Equity ratio = (Equity capital - Non-current assets) / Current assets
Xos = (p. 490 - p. 190) / p. 290 form No. 1
Xos = (p. 1300 - p. 1100) / p. 1200
According to the above order, the indicator is used as a sign of insolvency (bankruptcy) of the enterprise. The normal value of the equity ratio should be at least 0.1.
Long-term investment structure coefficient
This coefficient of financial stability of an enterprise shows the share of long-term liabilities among all assets of the enterprise. A low value of this indicator indicates the inability of the enterprise to attract long-term loans and borrowings. A high ratio indicates the organization’s ability to issue loans itself. A high value may also be due to strong dependence on investors. To calculate the structure coefficient of long-term investments it is necessary: Structure coefficient of long-term investments = Long-term liabilities / Non-current assets
What does the coefficient show?
The financial independence coefficient (FIC) indicates the share of the company's assets that can be formed from its own sources. Accordingly, the remaining assets are formed from borrowed sources.
This coefficient is important for determining the financial attractiveness of a potential borrower or partner by banking institutions and investors.
To determine the profitability of a company, it will also be useful to read the article “Determining return on assets (balance sheet formula)”.
Debt capital structure ratio
This financial stability coefficient shows the sources of formation of the enterprise's borrowed capital. From the source of formation, we can draw a conclusion about how the non-current and current assets of the organization are created, because long-term borrowed funds are usually taken for the formation of non-current assets (buildings, machines, structures, etc.) and short-term ones for the acquisition of current assets (raw materials, materials, etc.)
Debt capital structure ratio = Long-term liabilities / Non-current assets of the enterprise
Working capital coverage ratio from own sources of financing
The ratio shows whether the enterprise has its own funds necessary for its financial stability:
Working capital coverage ratio with own sources of financing = (Equity capital - Non-current assets) / Current assets
Ko = (p. 490 - p. 190)/(p. 290 - p. 230) form No. 1
Ko = (p. 1300 - p. 1100) / p. 1200
The methodological literature indicates that the enterprise is provided with its own sources of working capital financing with a coefficient value of ≥0.1.
Long-term leverage ratio
This financial stability ratio shows the share of sources of formation of non-current assets, which falls on long-term loans and equity capital. A high value of the coefficient characterizes the high dependence of the enterprise on raised funds.
Debt capital structure ratio = Long-term liabilities / (Long-term liabilities + Enterprise equity)
Conclusion A variety of financial stability ratios allows you to comprehensively determine and evaluate the success, nature and trends in the activities of an enterprise and the management of financial resources.
Author: Ph.D. Zhdanov I.Yu.
Total financial independence coefficient (COFI): formulas and calculation features
This indicator (COFN) reflects the ratio of its capital (with reserves) to the total amount of capital, assets (liabilities) of the enterprise. It should be noted that there are several formulas that exist and are used in practice for calculating the COFN, in particular: basic, by balance sheet, by groups and assets. The most common is the general, basic formula, which is the following ratio:
This formula is basic. To calculate it, you need to know the value of your capital (your financial sources) and assets (the amount of your own and borrowed capital). The numerator and denominator are determined according to accounting data. balance sheet of the enterprise for the period under study. The same formula may look different, namely:
“Decoding” of formula No. 2: P4 – capital and reserves, A1 – the most liquid assets, A2 – quickly liquid assets, A3 – slowly liquid assets, A4 – difficult to liquid assets.
The following formula assumes carrying out calculations based on data from the new accounting system. balance. That is, the meanings in it are the same as in the basic one, but it is presented in a line-by-line interpretation of the accounts. balance.
Separately, you should pay attention to another formula for calculating the COFN. In a situation where, according to information from the account. On the balance sheet, the enterprise has deferred income (FPI), i.e. balances on the relevant accounts, the COFN is subject to clarification. Then its refined value is calculated in the following way:
When calculating, you should take into account the fact that the amount of your capital, calculated according to accounting. balance may have some deviations and may not exactly correspond to the real value. The reason for such deviations (overstatements) may be, for example, deferred tax assets on the corresponding line of the balance sheet, or the presence of debts on contributions to the authorized capital. An underestimated amount of one’s capital may arise, for example, in the presence of deferred income that has been accrued but not yet received by the enterprise, etc.
The financial stability of an enterprise is characterized by a group of indicators that reflect the structure of its capital, the ability to repay its long-term debt and repay loans. The most important of them are:
· coefficient of autonomy (ownership);
· debt capital ratio;
· coefficient of financial dependence (financial leverage);
· creditor protection ratio (interest coverage ratio).
In the theory and practice of financial analysis, a large number of other coefficients related to the structure of the balance sheet are used. However, they do not formally carry new information, but are useful only from a substantive point of view, since they allow a more profound understanding of the situation (for example, the coefficient of long-term dependence, the coefficient of non-current assets, the coefficient of maneuverability, etc.).
The autonomy (ownership) coefficient shows the degree of independence of the enterprise from external sources of financing, or in other words, the share of equity capital in assets.
, (1.6)
where is equity;
– balance sheet asset.
The concentration ratio of debt capital dependence reflects the share of debt capital in sources of financing.
, (1.7)
Where ZK is borrowed capital.
The sum of the coefficients of autonomy and dependence is always equal to 1. The higher the first coefficient and, accordingly, the lower the second, the financial position of an enterprise is considered more stable. The decrease in the autonomy coefficient is associated with obtaining loans. This can lead to a significant deterioration in the financial situation during a downturn in market conditions, when income falls, and you have to pay interest at the same fixed rate and repay the principal. As a result, there is a real threat of loss of solvency of the enterprise. A situation is considered favorable when it is above 0.5, that is, equity capital exceeds liabilities.
The capital structure (financial leverage) coefficient is considered one of the main factors in characterizing the financial stability of an enterprise; it shows how many borrowed funds account for 1 ruble of own funds.
, (1.8)
This coefficient should not be more than 1. Its optimal value is 0.67 (40%: 60%).
High dependence on external loans can significantly worsen the situation of an enterprise if the pace of sales slows down, since the cost of paying interest on loans is considered a fixed expense. In addition, it may be difficult to obtain new loans.
In some cases, it is profitable for an enterprise to take out loans even if its own funds are sufficient, since the return on equity capital increases as a result of the fact that the effect of using borrowed funds is significantly higher than the interest rate for the loan.
The creditor protection ratio (or interest coverage ratio) characterizes the degree of protection of creditors from non-payment of interest on the loan provided.
(1.9)
The value of the interest coverage ratio must be greater than 1, otherwise the company will not be able to fully pay off its current obligations to creditors.
Profitability ratios
Profitability (efficiency) ratios characterize the efficiency of using assets and invested capital. Unlike indicators of liquidity and financial stability, intended to analyze the state of the enterprise on a certain date, profitability indicators reflect the results of the enterprise’s activities for a certain period of time (year, quarter).
In financial management, the following profitability indicators are most often used:
· profitability of enterprise assets;
· profitability of sales;
· return on invested capital;
· return on equity.
The return on assets of an enterprise is calculated by dividing net profit by the average annual value of assets and characterizes the effectiveness of investing in the assets of a given enterprise.
, (1.10)
where is net profit;
– total volume of assets (balance sheet total - net).
This indicator is the most important in assessing the competitiveness of an enterprise. The actual level of profitability of the enterprise's assets is compared with the industry average.
Return on sales is profit divided by the volume of products sold, calculated both on the basis of sales profit and net profit.
, (1.11)
where is sales revenue.
This indicator indicates the amount of profit (gross or net) brought by each monetary unit of products sold.
The dynamics of the product profitability indicator reflects changes in the pricing policy of the enterprise and its ability to control the cost of production.
Return on invested capital allows you to evaluate the effectiveness and appropriateness of relationships with investors, since it indicates the profitability of long-term capital.
(1.12)
Return on equity allows you to determine the effectiveness of the capital invested by the owners and compare this indicator with the possible income from investing these funds in other securities.
(1.13)
Results
Analyzing the financial independence ratio , we can come to the following conclusion: the higher this indicator, the more interest the company will be for potential investors.
At the same time, the coefficient being close to 1 is undesirable. This may indicate the presence of factors hindering the development of the enterprise.
To assess the company’s performance, it will be useful for potential investors to read the article “Calculation and formation of operating profit (formula)” .
You can find more complete information on the topic in ConsultantPlus. Full and free access to the system for 2 days.