Registered in the NRPA RB on December 14, 2011 N 5/34926
In order to ensure a unified methodological approach to assessing the solvency of business entities, timely identification of the instability of their financial condition and in accordance with Article 11 of the Law of the Republic of Belarus dated July 23, 2008 “On the Council of Ministers of the Republic of Belarus” and Article 10 of the Law of the Republic of Belarus dated July 13, 2012 “On economic insolvency (bankruptcy)” the Council of Ministers of the Republic of Belarus DECIDES:
1. As indicators for assessing the solvency of business entities <*> use the following coefficients (hereinafter referred to as solvency coefficients):
current liquidity ratio, which characterizes the overall provision of a business entity with its own working capital for conducting business activities and timely repayment of urgent obligations;
coefficient of provision with own working capital, characterizing the availability of a business entity with its own working capital necessary for its financial stability;
the ratio of the security of financial obligations with assets, characterizing the ability of a business entity to pay off its financial obligations after the sale of assets.
<*> For the purposes of this resolution, business entities are understood to mean state and non-state legal entities (except for budgetary, insurance organizations, banks and non-bank financial institutions, associations and unions, state-owned enterprises), their separate divisions with a separate balance sheet, individual entrepreneurs, who made the decision to maintain accounting records.
2. Approve the attached standard values of solvency ratios, differentiated by type of economic activity (hereinafter referred to as the standard values of the coefficients).
3. Establish that the criterion:
Liquidity. Calculation of liquidity ratios.
recognition of a business entity as solvent is the presence of a current liquidity ratio and (or) a ratio of provision with its own working capital at the end of the reporting period, depending on the main type of economic activity, having values greater than or equal to the ratios given in the standard values;
3.2. recognition of a business entity as insolvent is the presence at the same time of the current liquidity ratio and the ratio of the provision of own working capital at the end of the reporting period, depending on the main type of economic activity, having values less than those given in the standard values of the ratios;
3.3. insolvency that acquires a sustainable character is the insolvency of a business entity during the four quarters preceding the preparation of the last balance sheet;
3.4. Insolvency of a sustainable nature is the insolvency of a business entity during the four quarters preceding the preparation of the last balance sheet, and the presence on the date of preparation of the last balance sheet of the value of the ratio of the coverage of financial liabilities with assets exceeding the standard values of the ratios.
4. The Ministry of Finance, together with the Ministry of Economy, before December 30, 2011, determine the procedure for calculating solvency ratios and conducting an analysis of the financial condition and solvency of business entities, as well as take other measures to implement this resolution.
5. This resolution comes into force on December 30, 2011, with the exception of paragraph 4, which comes into force from the date of adoption of this resolution.
Prime Minister of the Republic of Belarus M. Myasnikovich
APPROVED Resolution of the Council of Ministers of the Republic of Belarus 12.12.2011 N 1672
STANDARD VALUES OF SOLVENT RATIO DIFFERENTIATED BY TYPES OF ECONOMIC ACTIVITY
———————-+——-+————+————-+—————+——————— ¦ ¦ ¦ ¦ Coefficient ¦ Coefficient ¦ ¦ ¦ Security Coefficient ¦ security Name of sections ¦ Sections ¦ Group ¦ current ¦ own ¦ financial ¦ ¦ liquidity - ¦ current ¦ liabilities ¦ ¦ ¦ standard (K1) ¦ funds - ¦ assets - standard ¦ ¦ ¦ ¦ standard (K2) ¦ (K3) - ——————-+——-+————+————-+—————+——————— 1. A. Rural 01 011 — 015 1.5 0, 2 for all types of farming, hunting and economic forestry 02 020 1.5 0.2 activities in accordance with 2. B. Fishing, 05 050 1.5 0.2 National fish farming classifier of economic types 3. C. Mining 10 - 14 101 - 141, 1.7 0.3 activities in industry 143 - 145 Republic of Belarus - no more than 142 1.2 0.15 0.85 4. D. Manufacturing 15 - 16 151, 1.3 0.2 industry 154 - 158 152 — 153, 1.7 0.3 159 1 — 193 1.3 0.2 20 — 21 201 — 212 1.7 0.3 22 221 1.1 0.15 222 — 223 1.7 0.3 23 — 25,231 — 252 1.4 0.2 26,261 — 268 1.2 0.15 27,271 — 275 1.3 0.2 28,281 1.2 0.15 282 — 287 1.3 0.2 29,291 — 292, 1.3 0.2 294 - 297 293 1.6 0.1 30 - 35 300 - 355 1.3 0.2 36 - 37 361 - 372 1.7 0.3 5. E. Production and 40 401 1.1 0.25 distribution of electricity, gas and 402 1.01 0.3 water 403 1.1 0.1 41 410 1.1 0.1 6. F. Construction 45 451 - 455 1.2 0.15 7 G. Trade, repair 50 - 52 501 - 519, 1.0 0.1 cars, household products 521 - 527 and personal items 8. H. Hotels and 55 551 - 552 1.1 0.1 restaurants 553 - 555 1.0 0.1 9. I. Transport and 60 - 63 601 - 634 1.15 0.15 communications 64 641 1.0 0.05 642 1.1 0.15 10. K. Operations with 70 701 - 703 1.1 0.1 real estate, rent and 71,711 - 714 1.1 0.15 provision of services to consumers 72,721 - 726 1.3 0.2 73,731 - 732 1.15 0.2 74,741 - 742 1, 0 0.05 743 - 748 1.2 0.15 11. O. Providing 90 - 93 900, 1.1 0.1 utility, 911 - 921 social and personal services 922 1.3 0.2 923 - 927, 1 .1 0.1 930 12. Other types of 1.5 0.2 economic activities ———————————————————————————————
Branded PC adapters……USB to KKL (VAG-COM 409) adapter
| USB - KKL (VAG-COM 409) adapter | ||
| rub. | ||
This KKL USB adapter (VAG-COM 409) supports ISO-9141, ISO 14230 (KWP2000) protocols and is intended for diagnostics:
— Volkswagen, Audi, Seat and Skoda using VAG-COM, VAG Tool or other analogues. The adapter works with all control units (ECU, ABS, Airbag, etc.) of VAG group cars up to and including 2003. As an exception, the adapter will also read some newer cars - for example, Audi A6 Allroad 2004 or Seat Ibiza 2005. — Injection vehicles that support OBDII specifications using the ISO-9141 or ISO-14230 / KWP2000 protocols ( Chevrolet Aveo, Lexus, etc. ) using the Vehicle Explorer program, OBD Tool, OBD Scan Tech or other analogues. VAZ / GAZ using Sens Diag, Motor Tester, My Tester VAZ, My Tester GAZ, Diagnostic tools, Auto VAZ, kwp_d, icd diagnostics and other analogues. — Daewoo using the programs Sens Diag, Daewoo AKM (T-Monitor), Daewoo Scan, kwp_d, etc. Changing and adjusting engine parameters without flashing the ECU. — Tavria, Slavuta, Lada using Sens Diag programs, etc. — Chevrolet Lacetti, Aveo using the Chevrolet Explorer program.
A diagnostic complex based on a conventional computer (or laptop) using this adapter allows you to read fault codes, read data streams, active tests of executive units, adjust constants (UZ, CO, etc.), adapt the immobilizer, record data (if available) access codes).
The adapter is equipped with a standard OBD-2 connector for connecting to a car, which eliminates connection errors, and is normally connected to USB.
KKL-USB OBD-2 adapter fully supports one of the OBD-2 data exchange protocols - ISO9141-2 (K, L-line). An additional feature of the adapter is the presence of a two-way L-line (ISO9141 provides only a one-way L-line, the main purpose of which is to provide a Wake up sequence to enter test mode, however, some Vag-group models use the L-line output for additional information exchange regarding other systems car (not engine)). Indication of the operation of the main channel - K-line is displayed by a two-color LED (high state corresponds to green, low state corresponds to red). (L-line is an auxiliary, parallel channel, duplicates the state of the K-line).
Diagnostic programs for different cars are available in large quantities on the Internet. The compatibility of a particular vehicle with the data exchange protocol - ISO9141-2 is most easily determined by the OBD-2 diagnostic block (the presence of certain pins indicates a specific data exchange protocol).
Criteria for assessing solvency. What do you need to consider?
ISO9141-2 protocol (manufacturer Asia - Acura, Honda, Infinity, Lexus, Nissan, Toyota, etc., Europe - Audi, BMW, Mercedes, MINI, Porsche, some WV models, etc., early models Chrysler, Dodge, Eagle , Plymouth) is identified by the presence of pin 7 (K-line) in the diagnostic connector. The pins used are 4, 5, 7, 15 (15 may not be present) and 16. ISO14230-4 KWP2000 (Daewoo, Hyundai, KIA, Subaru STi and some Mercedes models) is similar to ISO9141.
Equipment: 409.1 KKL OBDII adapter with USB cable, USB drivers and shareware programs.
Warranty period: 3 months. Manufacturer: Autotech TECHNOLOGY Co., Ltd, Shenzhen, China Importer in the Republic of Belarus: IP Nikitin R.S., UNP691388075
Archive of programs working with the KKL adapter - 49.5 Mb .rar Drivers for the KKL adapter - 3 Mb .rar "Vasya Diagnostic 1.1" program for VW, Audi, Seat, Skoda - 6.7 Mb .rar "FiatEcuScan 3.5" program for Fiat, Lancia, Alfa-Romeo - 20.2 Mb .rar
Related products:
| Adapter OBDII 16pin-VAG 2P+2P | Adapter OBDII 16pin - Fiat 3pin | Adapter OBDII 16pin - GM 12pin (GM, Daewoo, VAZ) |
Liquidity concept
The liquidity formula can be determined by the ratio of highly liquid assets, quickly marketable assets and slowly convertible assets to the most urgent liabilities and medium-term liabilities.
The critical liquidity indicator depends on the values that are reflected in the balance sheet of the enterprise. The balance sheet of any organization consists of two parts:
- Assets, which include resources in monetary value that a company controls;
- Liabilities, consisting of obligations that arise from an enterprise when it uses loans and credits.
Assets are divided according to their ability to be sold:
- illiquid,
- highly liquid,
- low liquid.
In relation to the balance sheet, an asset is a part of a table that contains property rights owned by an enterprise:
- cash,
- stocks,
- accounts receivable, etc.
Spread and everyday understanding of the issue
The most liquid asset is money, which can be easily converted into any other without financial loss. In the case of the sale of other material assets, the difference between the purchase and sale prices is called a spread. The higher it is, the lower the liquidity. To facilitate understanding, you can remember that the same thing, but for currencies, is called the term “convertibility”.
At the everyday level, every person understands that he needs a small amount for a rainy day. Moreover, it can be stored either in a current bank account or at home. In this way, he maintains his solvency for sudden financial obligations associated, for example, with the need to purchase medicines. There are many more risks associated with entrepreneurial activity, so it is necessary to calculate special indicators that will help you navigate and find the optimal balance of assets and liabilities.
Classification of assets and liabilities
To better understand the formula for the critical liquidity ratio on the balance sheet, it is necessary to consider the classification of assets and liabilities.
There are several types of company assets and liabilities that make up the liquidity formula.
Assets are classified into the following items:
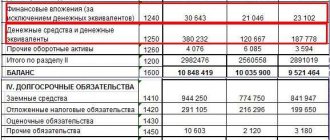
- A1– Highly liquid assets (line 1250) – securities, bills, cash,
- A2– Quickly realizable assets (line 1230) – funds for shipped products, services rendered,
- A3 Slowly convertible assets (p. 1220) – a long period of transformation into cash.
- A4 – Illiquid assets (for example, doubtful debts).
Liabilities can be classified as follows:
- P1 The most urgent liabilities (p. 1520),
- P2 Medium-term liabilities (line 1510),
Liquidity management
Maintaining the solvency of an enterprise is carried out in two ways: by distributing assets and liabilities. Liquidity management is based on the so-called GAP analysis, which allows you to balance the gap between available funds and liabilities with the corresponding maturity. Proper coordination of these categories is necessary to overcome unfavorable phenomena characteristic of the cyclical development of a market economy, for example, an industry downturn or a global crisis of the financial system. Quick/current ratio are the two main ratios used in financial analysis. They are calculated on the basis of the balance sheet.
Standard value of the critical liquidity indicator
The standard for the critical liquidity indicator is one. This means that all current debt can be repaid through the use of quickly salable assets.
If the coefficient is greater than one, then this situation reflects the state of the enterprise, which, when debts are repaid, will be left with quickly salable property.
In practice, it is still not possible to avoid accounts payable, so a critical liquidity ratio in the range from 0.5 to 0.8 is considered acceptable.
Current ratio standard
If the current ratio is greater than 2, this indicates that the company has more current assets than short-term liabilities with double coverage. An enterprise (company) has a high ability to pay off its obligations (debts) in the short term. The standard value of current liquidity equal to 2 was obtained in practice and is most often found in domestic regulations.
In world practice, the optimal coefficient is considered to be in the range from 1.5 to 2.5. If the current liquidity ratio is less than 1, then the enterprise cannot reliably pay off short-term obligations. The table below presents a comparison of domestic and international standards and the level of solvency of the enterprise.
| Indicator values | Standards | |
| Russian | International | |
| <1 | Critical solvency | Critical solvency |
| 1,5-2 | Low solvency | Satisfactory solvency |
| 2-3 | Satisfactory solvency | |
| >3 | High solvency / Possible irrational capital structure | |
Examples of problem solving
| Did you like the site? Tell your friends! |
The critical liquidity ratio should be within 0.7-1. If it is less, this indicates problems with solvency, the need to take measures to increase highly liquid assets (money, easily returnable receivables). It can be more than 1 if there are problems with returning money for shipped products.
Liquidity is the ability of an enterprise to quickly turn over its assets at an average market price. In a broad sense, this is the relationship between asset and liability. The term is used to assess the solvency of a company, and other indicators calculated on its basis indicate the turnover rate.
To assess the financial and economic condition of a company, the critical liquidity ratio (CLR) is used. It shows what part of the enterprise's short-term debt can be repaid using cash and expected cash receipts for products shipped or work performed (accounts receivable).
In simple words: how quickly the company will pay off current payments if a critical situation arises. That is, how well it is protected from business interruption thanks to highly liquid assets (cash and receivables). However, the quality of receivables (and whether they will be repaid on time) is just as important.
Economy Average:
Fig.1. Dynamics of the coefficient (without small businesses) in the Russian Federation (according to financial statements, in%)[1]
According to the Federal State Statistics Service, from 2000 to 2013, the average current liquidity of Russian companies in the economy as a whole was 102.5-136.2. At the same time, the economy functioned efficiently, Western creditors actively provided funds for development to Russian companies. That is, companies, in general, could meet their current obligations on time, and liquidity, in most cases, below two did not raise any questions.
Therefore, when analyzing, it is necessary to understand where the normative value 2 comes from and why, in most cases, it is irrelevant. As Gibson[2] points out, for a long period of time it was 2 that was considered the minimum acceptable value of the indicator. Since the mid-1960s, the current liquidity of a large number of successful companies has begun to decline. This is due to improved planning and budgeting processes, improved quality of control over accounts receivable and inventory movement. To determine the standard value of the indicator, it is necessary to compare the company’s current liquidity with the values of competitors in the industry. In many areas a value below 2 is adequate, while in others the optimal value is much higher. In general, the rule is that the longer the operating cycle, the higher the current liquidity ratio.
Therefore, in general, in the economy the value of the indicator is below the normative level - at the level of 121.1 at the end of 2014. This suggests that for every ruble of current liabilities in domestic companies there are 1,211 rubles of current assets.
Calculation formula for QCL
To calculate the indicator, the formula is used:
- AT – current assets;
- MPZ – inventories;
- OK – short-term liabilities.
Inventories are not taken into account. When calculating the coefficient, it is assumed that their liquidity is zero. That is, only those assets are taken with the help of which debts can be paid off most quickly. With cash, cash in checking accounts and expected payments for the supply of products, this will happen more quickly than with other material assets. Inventories also have to be sold, and this increases the time for fulfilling obligations.
The ratio is easily found on the basis of the enterprise’s balance sheet (Form 1).
- Page 1240 – value of line 1240 (financial investments excluding cash);
- Page 1250 – line value 1250 (money);
- Page 1260 – value of line 1260 (other current assets);
- Page 1500 – line value 1500 (sum of short-term liabilities);
- Page 1530 – value of line 1530 (deferred income);
- Page 1540 – value of line 1540 (estimated liabilities).
The coefficient can be calculated for different periods of time. But usually it is found in a year or quarter, much less often in a month. In parallel, you can calculate the current and absolute liquidity ratios.
Standard value of the coefficient
The calculated indicator of current liquidity of a normally operating solvent legal entity must be no lower than 1, i.e. it is necessary that the total value of current assets be greater than the amount of short-term liabilities. A ratio of a lower value may be a relative norm for organizations with a high capital turnover rate, in which the values involved in the calculation change frequently.
However, significant deviations in the direction of exceeding the standard value (equal to 1) are also undesirable. They indicate a slowdown in the turnover of current assets: overstocking of warehouses, the provision of unjustified deferments to customers for payment, ineffective use of money and financial investments.
The correctness of determining this ratio is significantly influenced by the quality of the data included in the calculation, which must be analyzed immediately before calculating this liquidity ratio. If the calculation involves data on assets that are not actually liquid (doubtful securities or accounts receivable, illiquid inventories), then the coefficient will be overestimated. The real picture will be distorted. It is better to exclude figures that are questionable from this point of view from the calculation. It must be taken into account that neither the considered liquidity ratio in itself, nor all 3 liquidity ratios together make it possible to unambiguously judge the financial and economic position of the enterprise, but are only a set of individual assessment indicators considered as elements of economic analysis.
Read about what other indicators are used when conducting financial and economic analysis in the material “Basic financial ratios and formulas for their calculation .
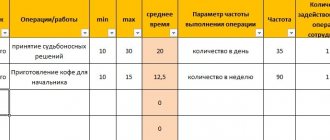
Calculation example
To calculate, you can use an excel document (download example).
| Index | ||||
| Cash, thousand rubles | 50 000 | 68 000 | 76 000 | 87 000 |
| Short-term financial investments, thousand rubles. | 32 000 | 48 000 | 65 000 | 88 000 |
| Short-term accounts receivable, thousand rubles. | 126 000 | 175 000 | 187 000 | 204 000 |
| Short-term accounts payable, thousand rubles. | 115 000 | 118 000 | 119 000 | 143 000 |
| Other short-term liabilities, thousand rubles. | 158 000 | 165 000 | 177 000 | 187 000 |
| Loans with a repayment period of up to a year, thousand rubles. | 98 000 | 76 000 | 65 000 | 70 000 |
| Critical liquidity ratio | 0,56 | 0,81 | 0,91 | 0,95 |
Thus, the lowest value of the indicator is observed in 2013 and is 0.56. This is below normal. In 2013, the company, using highly liquid assets, could cover only half of its current liabilities.
Comparison of current ratio with other liquidity indicators
In addition to the current ratio, in the practice of financial analysis, the quick ratio and the absolute ratio are often used. They show the ability of an enterprise to repay its debt obligations with quickly realizable and highly liquid types of assets.
Thus, the absolute liquidity ratio shows the ability of an enterprise to pay off its debts using the most liquid assets (cash and short-term financial investments). That is, this indicator shows the maximum speed with which a company can pay off creditors (and other borrowers).
The quick liquidity ratio shows the ability of an enterprise to pay off its debts using not only highly liquid assets, but also quickly realizable ones - these are short-term receivables.
Standard value
The standard value is from 0.7 to 1. If the coefficient is within these limits, this indicates that the enterprise is provided with quickly salable assets in an amount sufficient to repay short-term debt. That is, the company is solvent and quickly turns over goods/services. But since the ratio also takes into account accounts receivable, then, depending on its share in the assets, the indicator may be greater than 1. If the company has clients with whom problems constantly arise in paying for shipped goods/works/services, then depending The rate of the coefficient for a particular enterprise increases based on the amount of their debt.
When assessing CCL, it is important to take into account the risk of overdue receivables. The larger it is, the higher the share of other assets should be.
The growth and decline of the coefficient also speaks volumes.
| Index | Height (from 0.7) | Decrease (0.7 and below) |
| Solvency | Improves | Getting worse |
| Turnover of own funds invested in inventories | Improves | Getting worse |
| Investment attractiveness | Improves | Getting worse |
| Attractiveness for banks | Improved opportunity to obtain loans at low interest rates | Deteriorates, more interest, more collateral required, more likely to be denied a loan |
We must strive to ensure that the coefficient grows and is greater than 0.7, and ideally is in the region of 1. This value should not be greatly exceeded; this will be atypical for any enterprise and may result from ineffective management or a one-time injection of funds into highly liquid assets.
To improve the value, you can resort to the following methods:
- increase your own funds;
- take advantage of long-term loans;
- accelerate product turnover through sales promotion;
- reduce inventories;
- issue short-term loans;
- refuse to work with unscrupulous buyers.
Using the listed methods for improving the CCL value, it can be artificially increased if they are used for a limited time and then return to the old work scheme. Therefore, the calculation of the coefficient should be taken critically and assessed over time.
Why is it needed and what does it mean?
Let’s figure out what the coefficient values obtained in the examples mean. Obviously, a higher ratio means a stronger financial position. An indicator equal to or more than 1 is currently considered normal (although some sources suggest taking a value of 0.8 as the norm).
It indicates that the value of assets that can be quickly and (or) realized soon covers the volume of the company’s current liabilities or exceeds them.
If the indicator is lower, it means that the company may not have time to pay off its current debt in a short period of time. The resulting coefficient of 1.91 indicates a strong financial position. “Fast” assets covered current liabilities almost twice.
Speaking about the obtained dynamic values of the indicator from the example, we note that they are high both at the beginning of the year and at the end, although by the end of the year there was a slight decrease (5.16 and 4.18, respectively).
Current liabilities are covered several times by the corresponding type of assets. At first glance, this is a positive factor. At the same time, a value exceeding 3 may indicate, for example, an increase in short-term accounts receivable, ineffective work of the financial service with debtors, a carelessly compiled balance sheet, or problems in the primary accounting of the company’s assets.
In addition, a large volume of funds not in circulation, but in the cash register or in accounts, indicates their slow, ineffective use. Ultimately, such financial policies reduce the company's profits.
The coefficient reduces the volume of involved credit resources, loans, obligations to counterparties for a period of less than a year. The quality of information plays a decisive role when determining the coefficient. Thus, it is unacceptable to include in the calculation bad receivables and investments in securities if their quick liquidity seems doubtful; other data on assets whose quick liquidity is questioned.
Briefly
- The quick liquidity ratio is one of the most important financial indicators of a company's performance. It is calculated as the ratio of the sum of quick and highly liquid assets to current liabilities. The calculation is carried out according to the balance sheet data.
- Depending on the purposes of the analysis, the indicator is calculated for a certain period or over time: at the beginning and end of the period; in a few years. It demonstrates how many times “fast” assets cover the company’s current liabilities.
- A value equal to or greater than one is considered positive. A value exceeding 3 may indicate inefficient use of assets, slower turnover, poor handling of accounts receivable; below 1 - the company’s high dependence on short-term loans and borrowings that are not covered by appropriate resources.
Who will benefit from the coefficient?
The value of the critical liquidity ratio is important information for the head of the company and banks.
What managers and business owners evaluate by the coefficient:
- are there problems with solvency;
- is it possible to improve the investment attractiveness of the enterprise;
- whether the company can withstand the crisis;
- what are the chances of getting a loan, and under what conditions.
It is important for the head of the company to see the indicator over time and for the corresponding periods of previous years in order to reflect the overall picture of solvency.
What banks evaluate:
- whether the company has enough funds to repay the payments established by the schedule;
- what payment schedule is best to offer;
- is there a risk of loan non-repayment;
- Is additional security (collateral) required?
For credit institutions, the ratio serves as a measure of financial risk. If the indicator is low, then problems may arise with solvency. Accordingly, either these risks are included in the interest rate and loan security, or the bank refuses the service.
The relationship between theory and practice
The quick liquidity ratio of most enterprises is significantly less than the standard one. This is due to the questionable quality of receivables. Therefore, financial specialists use instant valuation indicators to analyze the actual liquidity of assets. To do this, consider the trends in the coefficient over a certain period, and then study the reasons for its decrease or increase. An increase in liquidity due to unjustified accounts receivable is evidence of serious financial problems in the enterprise. Therefore, for the purpose of analyzing the efficiency of production activities, it is important to use not only quantitative, but also qualitative indicators.