One of the characteristics of a stable position of an enterprise is its financial stability.
The following financial stability coefficients characterize independence for each element of the enterprise’s assets and for property as a whole, making it possible to measure whether the company is financially stable enough.
Autonomy coefficient
Financial dependency ratio
Debt to equity ratio
Maneuverability coefficient of own working capital
Ratio of mobile and immobilized assets
Working capital coverage ratio from own sources of financing
Own funds ratio
Inventory coverage ratio with own funds
Capital preservation ratio
The simplest financial stability ratios characterize the relationship between assets and liabilities as a whole, without taking into account their structure. The most important indicator of this group is the coefficient of autonomy (or financial independence, or concentration of equity capital in assets).
The stable financial position of an enterprise is the result of skillful management of the entire set of production and economic factors that determine the results of the enterprise. Financial stability is determined both by the stability of the economic environment within which the enterprise operates, and by the results of its functioning, its active and effective response to changes in internal and external factors.
The main task of analyzing the financial stability of an enterprise is to assess the degree of independence from borrowed sources of financing. In the process of analysis, it is necessary to answer the questions: how independent is the company from a financial point of view, is the level of this independence increasing or decreasing, and whether the state of its assets and liabilities meets the objectives of its financial and economic activities.
In the classical theory of financial reporting analysis, financial stability is understood as such a ratio of assets and liabilities of an organization that guarantees a certain level of risk of insolvency of the organization. Thus, as indicators of financial stability, coefficients characterizing the structure of assets and liabilities of the balance sheet, as well as the relationship between individual items of assets and liabilities ( relative indicators of financial stability)
).
Autonomy coefficient (financial independence, concentration of equity capital in assets)
Characterizes the independence of the enterprise from borrowed funds and shows the share of its own funds in the total cost of all funds of the enterprise. The higher the value of this coefficient, the more financially sound, stable and more independent the enterprise is from external creditors:
Autonomy (independence) coefficient = Own capital / Assets
Ka = (p. 490 + p. 640 + p. 650) / p. 700 form No. 1
or
Ka = page 490 / page 700
According to the form of the balance sheet since 2011, the formula has the form: Ka = line 1300 / line 1600
The normative generally accepted value of the indicator is considered to be a value of the autonomy coefficient greater than 0.5 but not more than 0.7. But it is necessary to take into account that the independence coefficient significantly depends on industry specifics (the ratio of non-current and current assets). The higher the share of non-current assets of an enterprise (production requires a significant amount of fixed assets), the more long-term sources are needed to finance them, which means that the share of equity capital should be greater (the higher the autonomy coefficient).
Note that in international practice, the debt ratio (financial dependence coefficient) indicator is widespread, which is the opposite in meaning to the autonomy coefficient, but also characterizes the ratio of equity and borrowed capital. A fairly high level of independence coefficient in the USA and European countries is considered to be 0.5-0.6. At the same time, the amount of liabilities does not exceed the amount of own funds, which provides creditors with an acceptable level of risk. In Asian countries (Japan, South Korea), a value of 0.3 is considered sufficient. In the absence of justified standards, this indicator is assessed dynamically. A decreasing value indicates an increase in risk and a decrease in financial stability. Moreover, with an increase in the share of liabilities, not only does the risk of non-repayment increase, in addition, interest expenses increase, and the company’s dependence on possible changes in interest rates increases.
Correct determination of the coefficient
The agility factor, like many other indicators, should be assessed based on a comparison of data from other enterprises in the industry.
Each area of economic activity may have its own optimal values. To correctly draw a conclusion about the state of affairs in the financial sector of a company, it is necessary to analyze the same indicator among competitors.
To do this, the required value is determined for each enterprise operating in the industry, and then the arithmetic mean is found. The coefficient of maneuverability of the research object's own funds should be compared with the obtained indicator for the industry.
Association by OKVED code will help to identify enterprises similar to the object of study. The results obtained should also be assessed over time. This approach regarding the object of research will allow us to make a correct assessment of the implementation of the financial and economic policy and strategy of the enterprise.
Financial dependency ratio
Financial dependence coefficient, characterizing dependence on external sources of financing (i.e., what share in the entire capital structure is borrowed funds). The indicator is widely used in the West. The indicator is defined as the ratio of total debt (sum of short-term liabilities and long-term liabilities) and total assets.
Financial dependence ratio = Liabilities / Assets
In accordance with the Order of the Ministry of Regional Development of the Russian Federation dated April 17, 2010 No. 173, the financial dependence coefficient is determined by the formula:
Kfz = (D0 + KO - Zu + Dbp + R) / P
where, Kfz - coefficient of financial dependence; D0 - long-term liabilities; KO - short-term liabilities; Zu - debt to the founders; Dbp - future income; P - reserves for future expenses; P - liabilities.
Kfz = (p. 590 + p. 690 - p. 630 - p. 640 - p. 650) / p. 700 f. No. 1
Kfz = (page 1400 + page 1500 - Zu - page 1530 - page 1540) / page 1700
Note that the line “Debt to participants (founders) for payment of income” (in the previous form - code 630) is excluded from the new form, since this debt is a payable and can be disclosed in the notes to the financial statements.
The recommended value of this coefficient should be less than 0.8. The optimal ratio is 0.5 (i.e. an equal ratio of equity and debt capital). If the indicator is less than 0.8, it means that liabilities should occupy less than 80% of the capital structure.
Formula for calculation
Maneuverability coefficients are calculated using various formulas. Information for calculations is taken from the company's balance sheet. The data used in calculations must be as accurate as possible. Only in this case can you get a reliable result. Let's consider the simplest formula for calculations (lines are taken from the balance sheet):
(Line 1300 – Line 1100) / Line 1300
Line 1300 is the amount of the organization’s own capital. The first stage of calculations (line 1300 - line 1100) helps determine the size of your own working capital. This formula is used under standard conditions.
If most of a company's liabilities include long-term liabilities, it makes sense to use a different, more complex formula. When calculating, an additional indicator is used - line 1400. Consider the form of the second formula:
((Line 1300 + line 1400) – line 1100) / line 1300
Another formula is needed if the majority of the structure consists of short-term liabilities:
(Line 1200 – Line 1500) / Line 1300
This formula can also be used for calculations:
((Line 1300 + line 1400 + line 1530) – line 1100) / (line 1300 + line 1530)
IMPORTANT! The formula should be selected in accordance with the characteristics of the company. This will provide more accurate results.
Debt to equity ratio
This ratio provides the most general assessment of financial stability. Shows how many units of borrowed funds account for each unit of equity:
Debt to Equity Ratio = Debt Capital / Equity Capital
Kzs = (p. 590 + p. 690 - p. 640 - p. 650) / (p. 490 + p. 640 + p. 650) form No. 1
or
Kzs = (p.590 + p.690) / p.490
Kzs = (page 1500 + page 1400) / page 1300
Analyze the change in the value of the indicator over time. The growth of the indicator in dynamics indicates the increasing dependence of the enterprise on external investors and creditors. Recommended value of Kzs <0.7. The optimal ratio of borrowed and equity funds is 0.5 < Kzs < 0.7. Exceeding the coefficient value of 0.7, i.e. Kzc >0.7 indicates that the financial stability of the enterprise is in doubt.
The higher the value of the indicator, the higher the risk level of investors, since in case of failure to fulfill payment obligations, the possibility of bankruptcy increases.
Instructions
- When analyzing financial stability, you can calculate the equity agility ratio.
It characterizes the share of sources of the enterprise’s own funds that are in mobile form. The agility coefficient shows which part of the own working capital is employed in circulation and which part is capitalized. At the same time, the enterprise can freely maneuver with working capital in mobile form. - To calculate the maneuverability coefficient, use the following formula: Km = SOS/SK, where SOS is own working capital; SK – equity capital. In other words, the agility coefficient is the ratio of the enterprise’s own working capital to its own sources of financing its activities. The recommended value for this indicator is 0.5 or higher. Its value depends on the type of activity of the enterprise. In capital-intensive industries, its normal level is, as a rule, lower than in material-intensive ones.
- You can see the amount of equity in Section III of the liabilities side of the balance sheet.
As for the volume of own working capital, this is an estimated value. You can find it in one of the following ways: 1) SOS = SK – VA, where SK is the equity capital of the enterprise; VA – non-current assets. 2) SOS = OA – KO, where OA – current assets; KO – short-term liabilities of the enterprise. This indicator characterizes the share of equity capital that is used to finance its current activities (formation of current assets). - You must take into account that in dynamics the coefficient of maneuverability should increase. However, its sharp growth is not evidence of normal development of the enterprise. This is due to the fact that an increase in this ratio is possible with an increase in the company’s own working capital or with a decrease in the enterprise’s own sources. This means that a sharp increase in this indicator will automatically cause a decrease in others, for example, the autonomy coefficient, which indicates an increased dependence of the enterprise on creditors.
© CompleteRepair.Ru
Financial stability ratio
Equity agility ratio
Equity agility ratio
— coefficient equal to the ratio of the company’s own working capital to the total amount of own funds. The data for its calculation is the balance sheet.
Equity agility ratio
shows the ability of the enterprise to maintain the level of its own working capital and replenish working capital, if necessary, from its own sources.
General formula for calculating the coefficient:
The coefficient of maneuverability of equity capital depends on the capital structure and the specifics of the industry; it is recommended in the range of 0.2-0.5, but universal recommendations on its value and trends are hardly possible.
| Financial dependence ratio The financial dependence ratio characterizes the extent to which the organization depends on external sources of financing, i.e. how much borrowed funds did the organization attract for 1 rub. own capital. It also shows the measure of the organization’s ability, having liquidated its assets, to fully repay its accounts payable. |
| K fz = Loans, loans, accounts payable Equity |
| The recommended value should be less than 0.7. Excess means dependence on external sources of funds. The growth of this indicator in dynamics means an increase in the share of borrowed funds in the financing of the enterprise, and, consequently, a loss of financial independence. If its value decreases to one, this means that the owners fully finance their enterprise. The financial dependence ratio of an enterprise means how much the assets of the enterprise are financed by borrowed funds. Too large a share of borrowed funds reduces the solvency of the enterprise, undermines its financial stability and, accordingly, reduces the confidence of counterparties in it and reduces the likelihood of obtaining a loan. However, too large a share of own funds is also unprofitable for the enterprise, since if the profitability of the enterprise’s assets exceeds the cost of sources of borrowed funds, then due to the lack of own funds, it is profitable to take out a loan. Therefore, each enterprise, depending on the field of activity and the tasks set at the moment, needs to establish for itself a standard value of the coefficient. |
| To the axis = Own working capital Current assets The presence of an enterprise with a sufficient volume of its own working capital (own working capital) is one of the main conditions for its financial stability. The absence of own working capital indicates that all the working capital of the enterprise and, possibly, part of the non-current assets (with a negative value of own working capital) were formed from borrowed sources. |
| The recommended value is greater than 0.6 - 0.8. |
Normative value ≤ 1
.
An increase in the ratio indicates an increase in the financial dependence of the enterprise. It shows how much equity is borrowed per ruble. The more the ratio exceeds 1, the greater the enterprise's dependence on borrowed funds. The acceptable level is often determined by the operating conditions of each enterprise, primarily by the rate of turnover of working capital. Therefore, it is additionally necessary to determine the rate of turnover of inventories and receivables for the analyzed period. If accounts receivable turn over faster than working capital, which means a fairly high intensity of cash flow to the enterprise, i.e. the result is an increase in own funds. Therefore, with a high turnover of tangible working capital and an even higher turnover of accounts receivable, the ratio of equity and borrowed funds can greatly exceed 1.
It is best to assess solvency using the operating capital maneuverability ratio. It shows what share of funds is in the company's turnover. The optimal value is considered to be in the range from 0 to 1.
How confident is the company in the market? Does she have solvency problems? Will it be able to overcome a small crisis in the industry without damage? Does it have enough funds to expand personnel and modernize production? An analysis of the solvency of the enterprise will allow answering these questions, to find which you will need the operating capital maneuverability coefficient, or abbreviated to K IFC.
Solvency analysis must be carried out to monitor the conduct of activities and assess the development of the company, as well as to identify and eliminate the irrational use of assets. Moreover, for this it is important to use different indicators that complement each other.
Ratio of mobile and immobilized assets
Shows how many non-current assets account for each ruble of current assets:
Ratio of mobile and immobilized assets = Current assets / Non-current assets
Km/i = (page 190 + page 230) / (page 290 - page 244 - page 252) form No. 1
or
Km/i = page 190 / page 290
Km/i = page 1100 / page 1200
No standard values have been established for this indicator.
Calculation example
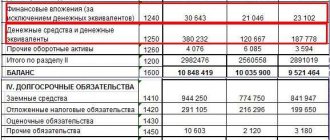
The table shows an example of a calculation for an enterprise with debts ().
| Indicator, t.r. | Jan. 17 | Feb. 17 | Mar. 17 | Apr. 17 | May. 17 | Jun. 17 |
| Line 1300 | 1 900 | 2 000 | 2 100 | 2 600 | 2 450 | 2 900 |
| Line 1100 | 1 800 | 1 600 | 1 900 | 1 500 | 1 800 | 1 900 |
| Line 1400 | 750 | 840 | 940 | 860 | 660 | 570 |
| KMFC | 0,447368 | 0,62 | 0,542857 | 0,753846 | 0,534694 | 0,541379 |
Thus, from January to June the value of the indicator fluctuates between 0.45-0.75. It fits into the agreed norms and therefore should not bother. However, it is important to continue to monitor the ratio and analyze it in the following months, so as not to miss the dangerous moment when the share of the company’s working capital begins to decline significantly and a real risk of insolvency appears.
The dynamics of the coefficient are best reflected on a graph.
Rice. 1. Coefficient in dynamics
Working capital coverage ratio from own sources of financing
The ratio shows whether the enterprise has its own funds necessary for its financial stability:
Working capital coverage ratio with own sources of financing = (Equity capital - Non-current assets) / Current assets
Ko = (p. 490 - p. 190)/(p. 290 - p. 230) form No. 1
Ko = (p. 1300 - p. 1100) / p. 1200
The methodological literature indicates that the enterprise is provided with its own sources of working capital financing with a coefficient value of ≥0.1.
Objective assessment of reliability
The maneuverability coefficient and an objective assessment of the borrower’s condition, taking into account possible risks, enable banks to effectively manage loan funds and make a profit from them. In today’s market conditions, an objective assessment of a partner’s reliability must be trusted to independent organizations. Commercial banks pay the greatest attention to indicators that characterize the client’s financial stability and solvency. It is more important for investors to analyze the potential and efficiency of invested capital from an economically advantageous point of view.
Own funds ratio
The coefficient of provision with own working capital shows the sufficiency of the enterprise's own funds necessary to finance current (operating) activities, i.e. ensuring financial stability. This indicator was introduced normatively by the Order of the Federal Fund for Financial Affairs of August 12, 1994 No. 31-r, and is not widespread in Western practice of financial analysis.
The formula for calculating the working capital ratio is as follows:
Equity ratio = (Equity capital - Non-current assets) / Current assets
Xos = (p. 490 - p. 190) / p. 290 form No. 1
Xos = (p. 1300 - p. 1100) / p. 1200
According to the above order, the indicator is used as a sign of insolvency (bankruptcy) of the enterprise. The normal value of the equity ratio should be at least 0.1.
Decoding the meaning
Based on the obtained coefficient value, you can find out what share of capital is used in financing current activities, and what share belongs to inventories and long-term liabilities.
When calculating, it is important to remember:
- There is a recommended value for the indicator, it is in the range of 0-1, but most companies should strive for a value of 0.2-0.5.
- The coefficient varies depending on the field of activity, features of the technological process, industry affiliation and other factors (for example, manufacturing enterprises will have less KMFC).
- It is useful to evaluate the value of the indicator over time.
We must strive to ensure that the indicator is low among the industry average. If it is noticeably higher than the norm, it means that the company has debts, and there is also a high risk of insolvency.
Table 1. KMFK value
| KMFC | Meaning |
| Below normal | There is a risk of insolvency, there may be a shortage of working capital |
| Fine | Stable position, the company is financially independent, working capital is abundant |
| Above normal | There is a risk of insolvency, there may be a shortage of working capital |
Inventory coverage ratio with own funds
The coefficient of provision of material inventories with own funds is an indicator characterizing the level of financing of inventories from the enterprise’s own sources (funds).
The formula for calculating the coefficient is:
Inventory coverage ratio with own funds = Own working capital / Inventories
Goats = (p. 490 + p. 590 - p. 190) / p. 210
Goats = (p. 1300 + p. 1400 - p. 1100) / p. 1210
In practice, there is a modified method for calculating this indicator; inventories are supplemented by costs (costs in construction in progress and advances to suppliers and contractors). In this case, the formula for calculating the ratio of supply of inventories and costs with own working capital will take the form:
Goats = (Equity + Long-term liabilities - Non-current assets) / (Inventories + Work in progress costs + Advances to suppliers and contractors)
The standard value of the coefficient lies in the range from 0.6 to 0.8, i.e. the formation of 60-80% of the enterprise's reserves should be carried out at its own expense. The higher the value of the indicator, the less dependence of the enterprise on borrowed capital in terms of the formation of reserves and, consequently, the higher the financial stability of the organization.
Operating capital maneuverability ratio
⇐ PreviousPage 19 of 19
,
Shows what part of the operating capital is immobilized in inventories and long-term receivables. A decrease in the indicator in dynamics is a positive fact.
Share of working capital in assets
,
L6≥0.5.
Financial stability analysis
An assessment of the financial condition of an organization will be incomplete without an analysis of financial stability. Under the financial stability of the organization
one should understand the provision of its reserves and costs with the sources of their formation.
The task of financial stability analysis is to assess the degree of independence from borrowed sources of financing. This is necessary to answer the questions: how independent is the organization from a financial point of view, is the level of this independence increasing or decreasing, and whether the state of its assets and liabilities meets the objectives of its financial and economic activities.
Financial stability is characterized by a system of absolute and relative indicators. The most general indicator of financial stability is the surplus or shortage of sources of funds for the formation of reserves and costs, which is defined as the difference in the value of sources of funds and the value of reserves and costs.
Sources of funds for the formation of reserves and costs (ZZ) are:
§ own working capital (SOS) = equity capital (SC) – non-current assets (AVN)
§ long-term loans and borrowings (DC)
§ short-term loans and borrowings (CC)
There are three indicators of the supply of inventories and costs by the sources of their formation:
Ø surplus (+) or shortage (-) of own working capital (S1):
±SOS=SOS – ZZ
Ø surplus (+) or lack (-) of own working capital and long-term credit (S2):
±(SOS + DK) = (SOS + DK) – ZZ
Ø surplus (+) or deficiency (-) of the total amount of sources of formation of reserves and costs, i.e. own working capital, long-term and short-term credit (S3):
±(SOS + DK+KK) = (SOS + DK+KK) – ZZ
Next, a three-dimensional situation indicator (three-dimensional vector) is applied.
S (S1, S2, S3)
The vector is constructed as follows: in the case of a surplus, 1 is written to the corresponding position of the vector, and in the case of a shortage, 0 is written. Depending on the combination of “0” and “1,” the vector can take four values, which mean the following:
S (1, 1, 1) – absolute stability
– shows that the organization has a surplus of all sources of inventory and costs, i.e. “absolute” solvency;
S (0, 1, 1) – normal stability
– the organization has a shortage of its own working capital, which is covered by surpluses from other sources, i.e. the organization has solvency, but is sometimes forced to resort to long-term sources to pay priority payments;
S (0, 0, 1) – unstable (pre-crisis) financial condition
- characterized by a violation of solvency, in which there is still the possibility of restoring balance. Instability is considered acceptable if the amount of short-term loans and borrowed funds attracted does not exceed the total cost of inventories and finished products.
S (0, 0, 0) – crisis financial condition
– the organization lacks all types of sources and, as a result, does not meet the requirements of creditors; it can be argued that the organization is on the verge of bankruptcy.
The analysis of absolute indicators of financial stability can be presented in the form of the following table:
Table 11.2 – Analysis of absolute indicators of financial stability
| Indicators | For the beginning of the year | At the end of the year | Changes, ± |
| Equity | |||
| Fixed assets | |||
| Availability of own working capital (SOS) | |||
| Long-term loans and borrowings (LC) | |||
| SOS+DK | |||
| Short-term loans and borrowings (CC) | |||
| SOS+DK+KK | |||
| Inventories and costs (ZZ) | |||
| Indicators | For the beginning of the year | At the end of the year | Changes, ± |
| ±SOS | |||
| ±(SOS+DC) | |||
| ±(SOS+DK+KK) | |||
| Three-dimensional indicator of financial stability | |||
| Type of financial stability |
A more accurate and frequently used way to assess the financial stability of an organization is to calculate the following ratios:
1. Capitalization ratio (leverage):
,
The normal limit is no higher than 1.5. Shows how much borrowed funds the organization raised per 1 ruble. own funds invested in assets.
2. Ratio of availability of own sources of financing:
,
Normal limit: lower limit 0.1, optimal value ≥0.5. Shows what part of current assets is financed from own sources.
3. Financial independence (autonomy) coefficient:
,
Normal limit: 0.4≤KA≤0.6. Shows the share of own funds in the total amount of financing sources.
4. Financing ratio:
,
Normal limit: CF≥0.7, optimal value ≈1.5. Shows which part of the activity is financed from own funds and which part is financed from borrowed funds.
5. Financial stability coefficient:
,
Normal limit: CFU≥0.6. Shows how much of an asset is financed from sustainable sources.
11.4.Assessment of profitability and business activity
The effectiveness and economic feasibility of the organization's functioning are measured by absolute and relative indicators, such as profit and profitability.
Profitability indicators are relative characteristics of the financial results and efficiency of an organization. They reflect the profitability of the organization and are grouped in accordance with the interests of participants in the economic process.
1. Profitability of property (assets)
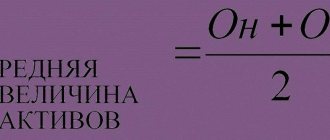
organization is calculated as a percentage of net profit to average assets.
Average value of assets = (value of assets at the beginning of the year + value of assets at the end of the year): 2.
2. Profitability of non-current assets
is defined as the percentage of net profit to the average value of non-current assets.
3. Return on current assets
is defined as the percentage of net profit to the average value of current assets.
4. Return on investment
= profit before taxes: (balance sheet currency – amount of short-term liabilities)×100.
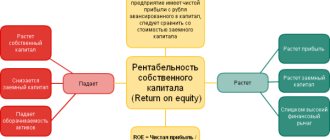
5. Return on equity
calculated as the ratio of book or net profit to equity.
6. Return on total capital
is calculated as the ratio of profit (net or book) to the balance sheet currency.
7. Sales profitability
is defined as the percentage of profit from sales to revenue from sales of products excluding VAT.
The assessment of business activity is aimed at analyzing the results and effectiveness of current core production activities.
The business activity of an organization is characterized by a number of indicators: the growth rate of revenue from the sale of goods, profits, assets, the efficiency of use of assets, the presence of profitable contracts for the sale of products, the purchase of raw materials, the presence of qualified personnel, etc.
The rate of economic growth is evidenced by the following:
1. the growth rate of balance sheet profit should outpace the growth rate of sales revenue, which means an increase in production profitability;
2. the growth rate of sales revenue should outpace the growth rate of assets, which means an increase in the efficiency of asset use;
3. All growth rates must be more than 100%.
A number of indicators are used to assess the efficiency of asset use.
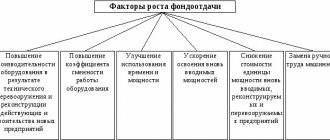
Key indicators of the use of the organization's fixed assets:
,
The greater the value of this indicator, the more efficiently fixed assets are used;
,
The higher the value of this indicator, the less efficiently fixed assets are used.
The main indicators of the use of intangible assets are calculated in a similar way.
Turnover of current assets
assessed by comparing the indicators of average balances of current assets and their turnover for the analyzed period. Turnovers when assessing and analyzing turnover are:
§ for inventories – costs of production of sold products;
§ for accounts receivable - sales of products by bank transfer (since this indicator is not reflected in the reporting and can only be identified from accounting data, in practice it is often replaced by an indicator of sales revenue).
Key indicators of the use of working capital:
1. Duration of one revolution in days
= (Average cost of working capital × Duration of the analyzed period) / Revenue from the sale of goods and services.
2. Turnover ratio (in revolutions)
= Revenue from sales of goods and services / Average cost of working capital.
3. Working capital utilization ratio
= 1/Turnover ratio = Average cost of working capital / Revenue from sales of goods and services.
The shorter the duration of one revolution, the greater the number of revolutions, and the less the number of working capital per 1 ruble. revenue, the more efficiently the organization’s working capital is used. Similar indicators can be calculated for each element of working capital:
Turnover of funds in calculations (in turnovers)
= Revenue from sales of goods / Average accounts receivable;
Turnover of funds in settlements (in days)
= 360 days / Funds turnover in turnover.
Accounts receivable collection ratio
= Average accounts receivable / Revenue from sales of goods and services.
Inventory turnover (in revolutions)
= Production costs/average inventory.
Inventory turnover (in days)
= 360 days / Inventory turnover in revolutions.
Accounts payable turnover (in days)
= (Average accounts payable × 360) / Production costs.
Equity turnover
= Revenue from sales of goods and services / Average equity capital.
Cash turnover (in days)
= (Average cost of cash × 360) / Revenue from the sale of goods and services.
11.5.Criteria for assessing the insolvency (bankruptcy) of an organization
Federal Law “On Insolvency (Bankruptcy)” dated October 26, 2002 No. 127-FZ establishes the grounds for declaring a debtor insolvent (bankrupt), regulates the procedure and conditions for implementing measures to prevent insolvency (bankruptcy), the procedure and conditions for conducting bankruptcy procedures and others relations arising when the debtor is unable to fully satisfy the demands of creditors.
Insolvency (bankruptcy)
is the inability of a debtor recognized by an arbitration court to fully satisfy the claims of creditors for monetary obligations and (or) to fulfill the obligation to make mandatory payments.
A legal entity is considered unable to satisfy the claims of creditors for monetary obligations and (or) fulfill the obligation to make mandatory payments if the corresponding obligations and (or) obligations are not fulfilled by it within three months from the date on which they should have been fulfilled.
A bankruptcy case may be initiated by an arbitration court, provided that the requirements against the debtor - a legal entity
in the aggregate amount to
at least one hundred thousand rubles
, to
the debtor - citizen
-
at least ten thousand rubles
, and there are also other signs of bankruptcy.
For a preliminary analysis of the financial condition of an enterprise, the Russian Federal Service for Financial Recovery and Bankruptcy developed and approved “Methodological provisions for assessing the financial condition of enterprises and establishing an unsatisfactory balance sheet structure” (No. 31-r dated August 12, 1994).
Analysis and assessment of the structure of the enterprise’s balance sheet is carried out on the basis of the following indicators:
1. current ratio;
2. equity ratio.
The basis for recognizing the structure of the balance sheet of an organization as unsatisfactory, and the organization itself as insolvent, is the fulfillment of one of the following conditions:
— the current liquidity ratio at the end of the reporting period is less than 2;
— the equity ratio at the end of the reporting period is less than 0.1.
The main indicator characterizing whether an organization has a real opportunity to restore (or lose) its solvency during a certain period is the coefficient of restoration (loss) of solvency.
If at least one of the specified coefficients has a value less than the normative one, the solvency restoration coefficient is calculated for a period set at 6 months.
If the current liquidity ratio is greater than or equal to 2, and the equity ratio is greater than or equal to 0.1, the loss of solvency ratio is calculated for a period set to 3 months.
The solvency restoration coefficient is determined by the formula:
where K1f is the actual value of the current liquidity ratio (K1) at the end of the reporting period;
K1n – the value of the current liquidity ratio at the beginning of the reporting period;
K1norm – standard value of the current liquidity ratio, K1norm = 2;
6 – period of restoration of solvency in months;
T – reporting period in months.
The solvency restoration coefficient, taking a value greater than 1, calculated for a period of 6 months, indicates that the organization has a real opportunity to restore its solvency.
A solvency restoration coefficient taking a value less than 1, calculated for a period of 6 months, indicates that the organization has no real opportunity to restore solvency in the near future.
The coefficient of loss of solvency is determined by the formula:
where K1f is the actual value of the current liquidity ratio (K1) at the end of the reporting period;
K1n – the value of the current liquidity ratio at the beginning of the reporting period;
K1norm - standard value of the current liquidity ratio;
K1norm = 2;
3 – period of loss of solvency of the enterprise in months;
T – reporting period in months.
The coefficient of loss of solvency, taking a value greater than 1, calculated for a period of 3 months, indicates that the enterprise has a real opportunity not to lose solvency.
The coefficient of loss of solvency, taking a value less than 1, calculated for a period of 3 months, indicates that the enterprise has the possibility of losing solvency in the near future.
Control questions:
1. Define the difference between the concepts of “balance sheet liquidity” and “asset liquidity”.
2. Describe what is meant by the financial stability of an organization.
3. Reveal how the assets and liabilities of the balance sheet are grouped when assessing its liquidity.
4. List and characterize the types of financial stability.
Literary sources:
1. Kondrakov N.P. Accounting: Textbook. – M.: INFRA-M, 2013. – 592 p.
2. Savitskaya G.V. Analysis of the economic activity of an enterprise: Textbook. – 4th ed., rev. and additional – M.: INFRA-M, 2013. – 330 p. – (Secondary vocational education).
3. Savitskaya G.V. Methodology of complex analysis of economic activity: A short course. – 4th ed., rev. – M.: INFRA-M, 2012. – 320 p. (Higher education).
Internet resources:
1. Official website of the Ministry of Finance of the Russian Federation - https://www.minfin.ru.
2. Official website of the Federal Tax Service of Russia https://www.mosnalog.ru.
GLOSSARY
Letter of Credit
- a conditional monetary obligation accepted by the bank on behalf of the payer to make payments in favor of the recipient of funds upon presentation by the latter of documents that comply with the terms of the letter of credit, or to authorize another bank to make such payments.
Analytical accounting
– accounting of detailed data on certain types of property and liabilities, maintained on analytical accounts in natural, labor and cost measures.
Accounting entry (accounting entry, correspondence of accounts)
– indication of the accounts debited and credited for this transaction and the amount of the business transaction.
Financial statements
– a system of indicators characterizing the production and financial activities of an organization for a certain period (month, quarter, year).
Balance sheet
– a method of economic grouping and generalization of information about the property and liabilities of an organization in monetary value as of a certain date.
accounting document
– a paper or computer storage medium that gives the right to carry out a business transaction or confirms the fact of its execution.
Account
– an economic grouping in the form of a table in which current information on the state and movement of certain types of property and obligations of the organization is accumulated and systematized.
Accounting
– an orderly system for collecting, registering and summarizing information in monetary terms about the property, obligations of organizations and their movement through continuous, continuous and documentary accounting of all business transactions.
Finished products
- these are products and semi-finished products that are fully processed, complying with current standards or approved technical specifications, accepted by the warehouse or by the customer.
Accounts receivable
– debt of organizations, employees and individuals (debtors) to an economic entity.
Business reputation of the organization
– the difference between the purchase price of an organization as a property complex and the book value of its property.
Agreement
– an agreement between two or more persons on the rights, duties and responsibilities for fulfilling obligations.
Loan agreement
- a type of agreement under which one party (lender) transfers money or other things defined by generic characteristics into the ownership of the other party (borrower), and the borrower undertakes to return to the lender the same amount of money (loan amount) or an equal number of other things received by him of the same kind and quality.
Documentation
– primary registration of business transactions using established forms of primary accounting documents at the time and place of the transaction.
Document flow
– the order of movement of documents from the moment of their preparation or receipt from other organizations to their use in accounting and subsequent transfer to the archive.
Debt securities
– obligations placed by the issuing organization on the stock market to attract funds on a repayable and reimbursable basis.
Wage
– remuneration for labor to be paid to employees of the organization depending on their qualifications, as well as the complexity, quantity, quality and conditions of the work performed.
Organization costs
- funds spent on the acquisition of available resources and recorded on the balance sheet as assets of the organization that can generate income in the future.
Inventory
– a method of checking whether the actual availability of property corresponds to accounting data.
Costing
– a method of grouping costs and determining the cost of finished products.
Business trip
– a trip by an employee, by order of the head of the organization, for a certain period of time to another location to carry out an official assignment outside the place of permanent work.
Loan agreement
- an agreement under which a bank (or other credit institution) undertakes to provide funds (loan) to the borrower in the amount and on the terms stipulated by the agreement, and the borrower, in turn, undertakes to return the amount received and pay interest on it.
Accounts payable
– debt of an economic entity to other organizations, employees and individuals (creditors).
Marginal analysis
is
a method of assessing and justifying the effectiveness of management decisions in business based on the cause-and-effect relationship of sales volume, cost and profit and dividing costs into fixed and variable.
Inventories
- part of the organization’s property used by it as objects of labor in the production cycle.
Double entry method
– a method of registering business transactions, which consists in the fact that each operation affects at least two accounting objects.
A methodology
is
a set of rules, techniques and methods for the expedient performance of any work.
Economic analysis method
is a dialectical approach and ways of studying, measuring and summarizing the influence of numerous factors on changing the results of an organization's activities in order to improve them.
Tax accounting
– this is a type of accounting in which information is summarized in order to determine the tax base for taxes based on data from primary documents, grouped in accordance with the procedure provided for by the Tax Code of the Russian Federation.
Insolvency (bankruptcy)
is
the inability of a debtor recognized by an arbitration court to fully satisfy the claims of creditors for monetary obligations and (or) to fulfill the obligation to make mandatory payments.
Operational accounting
– a subtype of economic accounting, which is carried out for the daily current management and management of the organization and is carried out directly at the workplace of primary production units.
Fixed assets
– a set of material assets used as means of labor in the production of products, performance of work or provision of services, or for the management of an organization for a period of time exceeding 12 months.
Deferred tax asset
– part of deferred income tax, which should lead to a reduction in income tax payable to the budget in the next reporting period or in subsequent reporting periods.
Deferred tax liability
– part of deferred income tax, which should lead to an increase in income tax payable to the budget in the next reporting period or in subsequent reporting periods.
Grade
– a way of expressing in monetary terms the property and obligations of an organization.
Solvency
– this is the ability to timely and fully pay for one’s obligations
.
Payment order
– an order of the account owner (payer) to the bank servicing him, documented in a settlement document, to transfer a certain amount of money to the recipient’s account opened in this or another bank.
Contractors
– organizations carrying out construction, installation and repair work for an economic entity.
Accountable persons
– employees of the organization who receive funds for travel expenses and business needs.
Suppliers
– organizations that supply raw materials, goods and various services to an economic entity.
Profit
– the amount of excess of an organization’s income over its expenses.
Calculations
– a system of monetary relations associated with payment for goods, works, services of legal entities and individuals, as well as with the fulfillment of financial obligations.
Synthetic accounting
– accounting of generalized data on property and liabilities, maintained on synthetic accounts and only in monetary terms.
Doubtful debt
– receivables of an organization that have not been repaid within the terms established by the contract and are not secured by appropriate guarantees.
Means of labor
- a set of objects that are used for production purposes, operate in an unchanged form for a long period of time and lose their value gradually, by being transferred to a newly created product.
Statistical accounting
– a subtype of economic accounting that studies phenomena of a mass nature.
Subaccount
– additional grouping of economic assets within a specific synthetic account.
Trade margin
– added value to the purchase price of a product, intended to reimburse trade expenses (distribution costs), generate profit and pay indirect taxes.
Management Accounting
– a subtype of accounting, the system of which generates data necessary for making management decisions within the organization.
Authorized capital
– the amount of funds initially invested by the owners to ensure the statutory activities of the organization.
Accounting policy
– a set of accounting methods adopted by the organization.
Accounting registers
– books, cards, magazines, separate sheets or other media intended for systematization and accumulation of information contained in primary documents accepted for accounting, for reflection in accounting accounts and financial statements.
Accounting meter
– a specific accounting unit that measures and calculates economic assets and operations of an economic entity.
Financial condition of the enterprise
is an economic category that reflects the state of capital in the process of its circulation, and the ability of a business entity to self-development at a fixed point in time.
Financial investments
– a group of assets owned by an organization that is used to generate income, increase the value of capital or obtain other benefits, in particular to influence other organizations.
Accounting Form
– the order of combination of accounting registers and the sequence of entries in them.
Economic accounting
– quantitative expression and qualitative characteristics (observation, measurement and registration) of facts of economic activity, their grouping and generalization.
⇐ Previous19
Recommended pages:
Use the site search:
Indicator analysis
For calculations, data can be taken for different periods - from a month to a year.
It is best to carry out the analysis in dynamics, to evaluate changes over a certain time. Table 2. What characterizes the growth and decline of CM
| Height | Decline |
| The loan burden does not increase. | The share of loans among the company's assets is increasing. |
| The company has funds to expand and modernize production. | There are not enough funds to invest in production. |
| Additional funding resources are available. | There are no other sources of funding. |
| Fewer unnecessary costs associated with servicing loans. | More profits are spent on debt servicing. |
Thus, an increase in the indicator means that the company’s business is getting better, there are fewer debts, and a minimum of money is spent on servicing them. The fall indicates a negative trend for the enterprise: an increase in the credit mass in the assets, a reduction in financial reserves.