Drawing up a forecast balance
The purpose of preparing a forecast balance sheet is to develop an integrated set of financial forecasts that reflect the company's expected performance. These forecasts must have:
- Appropriate level of detail: A typical forecast has at least two periods;
- the level of detail is "as simple as possible, but not simpler." Very detailed forecasts of individual accounting elements rarely make sense; it is better to pay more attention to the calculations of ratios and their forecasts.
- incoming information, calculations and outgoing information;
The level of detail should be less, the longer the period the company makes a forecast.
Stage 1: Detailed forecast for 3-7 years (usually 5):
- Aggregated balance sheets and profit and loss statements are developed;
- income must be predicted using real coefficient values;
- forecasts of other indicators, referring to real ratios or calculated as a percentage of income using expert estimates.
Stage 2: Simplified forecast for an additional 3-7 years:
- need to focus on several important variables such as revenue growth, profitability, capital turnover;
- this stage can be combined with stage 1 if the coefficient values can be predicted for such a long period.
Stage 3: “Stable State”
- the remaining number of years must be estimated using terminal values, formulas, multiples, or salvage values.
In modeling, very few things can really be predicted 10 (or even 5) years out. Therefore, the following assumptions are used in step 3:
- stable growth and reinvestment of operating profits;
- constant ROIC;
- at least one business cycle in the forecast period.
Forecasting: Some Best Practices
To prevent balance forecast models from being chaotic, it is necessary to take into account that clear structuring at the beginning of model construction saves a lot of time during further development.
Good models have certain characteristics. First, the raw data is collected in only a few places. Second, raw data (or user data) and calculations need to be marked separately (for example, using different colors).
Forecast balance: example of calculation in Excel (example of the structure of a working file).
Many spreadsheet options are possible. For example, an Excel workbook might contain six worksheets:
- Input data consisting of the company's financial indicators.
- Adjusted financial results based on input data: Based on how detailed the analysis needs to be, you should at a minimum compare revenue, operating profit and financial profit to the latest available values;
- you need to start with aggregate numbers, refining to the desired level of detail.
Projected balance sheet of an enterprise: calculation example
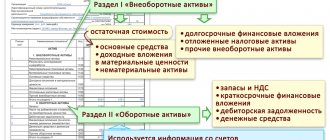
Although the future is unknown, a careful analysis can provide insight into how the company may evolve. Forecast balance sheet methods usually involve a step-by-step process. The forecasting process can be broken down into six steps:
- Prepare and analyze historical financials. Before forecasting future financial results, you need to build and analyze financial indicators of past periods.
- Create a revenue forecast. Almost every position will be directly or indirectly dependent on income. You can estimate future earnings using either a top-down (market-based) or bottom-up (customer-based) approach. Forecasts must be consistent with growth history, understanding of market developments, and the company's ability to gain market share.
- Income Statement Forecast/Income and Expense Budget (I&B). Use appropriate economic ratios for all items at the appropriate level of detail.
Forecast of income and expenses (BDR)IndicatorsBudget periodTotal 1234
| Sales volume (units) | 800 | 700 | 900 | 800 | 3 200 |
| Revenue | 64 000 | 56 000 | 72 000 | 64 000 | 256 000 |
| Production cost | 32 740 | 28 428 | 37 654 | 33 224 | 132 046 |
| Variables commercial | 3 200 | 2 800 | 3 600 | 3 200 | 12 800 |
| Administrative variables | — | — | — | — | — |
| Marginal profit | 28 060 | 24 772 | 30 746 | 27 576 | 111 154 |
| Prod. permanent invoices | 6 000 | 6 000 | 6 000 | 6 000 | 24 000 |
| Commercial permanent | 5 100 | 5 100 | 5 100 | 5 100 | 20 400 |
| Administrative permanent | 5 230 | 4 950 | 4 950 | 4 950 | 20 080 |
| Operating profit | 11 730 | 8 722 | 14 696 | 11 526 | 46 674 |
| Interest receivable | — | — | — | — | — |
| Percentage to be paid | — | — | 579 | 200 | 779 |
| Profit before tax | 11 730 | 8 722 | 14 118 | 11 326 | 45 896 |
| Income tax (20%) | 2 346 | 1 744 | 2 824 | 2 265 | 9 179 |
| Net profit | 9 384 | 6 978 | 11 294 | 9 061 | 36 716 |
Table 1. Forecast of MDD
- Drawing up a forecast balance: invested capital and non-operating capital
- investor funds. Complete the balance sheet by calculating retained earnings and forecasting other accounts.
Use cash and/or debt accounts to balance.
Cash Flow Forecast (CFF)IndicatorsBudget period1234
| Balance at start | 10 000 | 10 500 | 7 481 | 7 597 |
| Cash receipts from core activities | ||||
| Revenues from sales | 54 300 | 57 120 | 66 080 | 64 960 |
| Advances received | — | — | — | — |
| Total receipts | 54 300 | 57 120 | 66 080 | 64 960 |
| Cash payments from operating activities | ||||
| Direct materials | 2 370 | 4 509 | 4 866 | 5 164 |
| Direct labor | 20 000 | 17 250 | 23 000 | 20 250 |
| General production expenses | 14 000 | 12 900 | 15 200 | 14 100 |
| Business expenses | 8 300 | 7 900 | 8 700 | 8 300 |
| Administrative expenses | 5 130 | 4 850 | 6 050 | 4 850 |
| Income tax | 4 000 | |||
| Total payments | 53 800 | 47 409 | 57 816 | 52 664 |
| NPV from core activities | 500 | 9 711 | 8 264 | 12 296 |
| Cash flows from investing activities | ||||
| Purchase of fixed assets | — | 24 300 | — | — |
| Long-term financial attachments | — | — | — | — |
| Sales of fixed assets | — | — | — | — |
| Implementation of financial investments | — | — | — | — |
| NPV from investment activities | — | -24 300 | — | — |
| Cash flows from financing activities | ||||
| Getting loans | — | 11 570 | 4 000 | — |
| Loan repayment | — | — | 11 570 | 4 000 |
| Loan interest payments | — | — | 579 | 200 |
| NPV for financial activities | — | 11 570 | — 8 149 | — 4 200 |
| Balance at the end | 10 500 | 7 481 | 7 597 | 15 693 |
Table 2. DDS forecast
Balance ForecastArticle NameStartFinally
| Assets | ||
| Current assets | ||
| Cash | 10 000 | 15 693 |
| Accounts receivable | 9 500 | 28 160 |
| Supplies, including: | 3 754 | 4 600 |
| materials | 474 | 500 |
| finished products | 3 280 | 4 100 |
| Total current assets | 23 254 | 48 453 |
| Long-term assets | ||
| Fixed assets | 100 000 | 124 300 |
| Earth | 50 000 | 50 000 |
| Accumulated depreciation | 60 000 | 73 400 |
| Total permanent assets | 90 000 | 100 900 |
| Total assets | 113 254 | 149 353 |
| Passive | ||
| Current liabilities | ||
| Short-term loans and borrowings | — | — |
| Accounts payable | 2 200 | 3 437 |
| Debt to the budget | 4 000 | 2 146 |
| Total current liabilities | 6 200 | 5 583 |
| Long-term debt | ||
| Long-term loans and borrowings | — | — |
| Other long-term liabilities | — | — |
| Total long-term liabilities | — | — |
| Equity | ||
| Share capital | 70 000 | 70 000 |
| retained earnings | 37 054 | 73 770 |
| Total equity | 107 054 | 143 770 |
| Total liabilities | 113 254 | 149 353 |
Table 3. Forecast balance using the example of a manufacturing enterprise
- Calculate your discount rate
FCFF = FCFE + FCFD,
where FCFD is cash flow to creditors;
FCFE is cash flow to owners.
recordings of past webinars on the topic “Cash Management”
A. To complete the forecast, free cash flow must be calculated as a basis for valuation. Future cash flow should be calculated in the same way as actual cash flow.
b. Calculate ROIC to support projections consistent with economic principles, industry dynamics, and the company's competitive advantages.
With. Make graphs for the model to summarize key results.
Thus, the process of drawing up a forecast balance to obtain an adequate result must be well structured, and calculations of indicators can be best implemented using a specialized software product, for example, WA: Financier .
Source: https://www.1CashFlow.ru/sostavlenie-prognoznogo-balansa
Forecast balance and its preparation using an example
In the article we will try to describe what approaches are used in planning, how to calculate the need for financing, why a forecast balance is needed, and its place in ensuring the financial stability of an enterprise.
If you are interested in automation of budgeting, implementation of treasury or accounting according to IFRS, check out our special offer.
First of all, it is necessary to determine the basis for planning. Typically the basis is activity in past periods. The main driver for the effective development of any enterprise is sales growth.
The results of an enterprise's activities for the previous period are described in the income statement (profit and loss statement).
A tool for planning the income and expenses of an enterprise is the income and expense budget (IBB), which can take the form of a profit and loss statement (P&L).
Read other articles on optimizing company finances.
BDR cost structure
Variable expenses grow in proportion to sales growth, for example, raw materials, payroll of production personnel. Fixed costs remain unchanged or increase in steps, for example, when a new larger building is needed when expanding a business.
In addition, some costs can be attributed to the cost of a specific product - such costs are called direct, and some are distributed between different types of products (indirect costs). Examples of indirect costs include marketing and advertising, management and administrative expenses.
When compiling a financial statement, it is useful to analyze what percentage of revenue each type of expense represents. This will help us calculate planned costs for future revenue growth.
Example of calculating the balance of the previous period
As sales increase, working capital increases. The efficiency of working capital management can be calculated through ratios. Basic working capital ratios in days:
- Material turnover period = Average annual cost of inventories from the balance sheet * 365/Cost price from operating statement;
- Receivables turnover period (AR) = Average annual value of RRP from the balance sheet * 365 / Revenue from profit and loss;
- Accounts payable turnover period (AC) = Average annual cost of accounts payable from the balance sheet * 365 / Cost of operating expenses;
- Cash turnover period (CF) = Average annual cost of CF from the balance sheet * 365 / Revenue from operating profit.
In addition to working capital, the balance sheet asset contains non-working capital, such as fixed assets (fixed assets) and intangible assets (intangible assets). Similar to working capital, efficiency can be calculated using the formula:
- Turnover period of fixed assets and intangible assets = ((Average annual cost of fixed assets - depreciation of fixed assets) + (Average annual cost of fixed assets - depreciation of intangible assets)) / Revenue from operating income.
Let's move on to the passive part of the balance sheet. Most often, the financing of a company’s activities is carried out through borrowed funds (we will discuss the advantages and disadvantages of this approach in the next article).
However, interest must be paid on borrowed funds. As the company grows, attracting financing becomes especially important.
And here it is important to remember one rule: “the rate of change in net profit must be greater than or equal to the rate of change in revenue” (Tizm.chp>=Tizm.vyr.)
How to correctly calculate the need for financing when growing a company based on its financial condition?
In our example, we have a budget on a balance sheet (BBL):
Balance
Profit and loss report 2012
We can calculate efficiency indicators for asset and working capital management for 2012:
Drawing up a forecast balance
Based on the data described above, we give an example of calculating the forecast balance.
Let's say we plan to increase sales by 20%. Then the main indicators of operating profit will increase in proportion to the growth of revenue:
The cost is 54% of revenue, respectively, if the current gross profitability rate is maintained, the new cost will be 708 * 54% = 384, wages and depreciation are calculated in the same way. The interest for servicing short-term and long-term obligations is calculated as (77+3.5)*%=7, resulting in 8.70%. We leave interest expenses for 2013 empty for now; we will get them by calculation.
Let's move on to building a budget based on the forecast balance sheet:
The main lines of the active part of the forecast balance vary depending on the turnover period in days. Deferred expenses can be calculated as a percentage of revenue (4+6)/ 2*590 = 0.85%, and we calculate taxes in the same way.
Thus, it turns out that the company requires assets in the amount of 379.80, but we have only 372 million of our own funds, where to get the rest - 7.8 million. For simplicity, we assume that long-term liabilities do not change, we will finance through short-term loans and loans.
However, in reality, more than 7.8 million will be required, since % will have to be added to the amount of short-term and long-term liabilities. The amount % will reduce retained earnings in profit and loss.
Thus, we need to select a value of short-term loans that would satisfy the balance equation. If retained earnings decrease in the forecast balance, the amount of short-term liabilities will increase.
In our example we got the following values.
Forecast income statement
Forecast budget according to balance sheet
What main conclusions can be drawn based on the data obtained?
The growth of net profit on operating profit is 16%, which is clearly less than the growth of revenue (20%). In our example, this happened due to an increase in the credit load. The company is growing so fast that its profits are not enough to support growth.
It is necessary to borrow.
This trend can lead to the fact that all the added net profit will be consumed by interest, and the company will be forced to grow in order to service loans (we will talk about methods for optimizing activities in the following articles).
As for short-term debt, its value has increased more than 4 times. It is important to remember here that as the company grows, an increase in liabilities is inevitable, but this process must always be kept under control in order to avoid excessive credit burden.
Now for a little self-promotion :).
This scheme for constructing a forecast balance can be built in Excel. But more accurate data and faster collection of information are only possible in an automated system. The knowledge and experience of our company will help you build a budget process, make it effective, dynamic and manageable. We specialize in the most popular platform today - 1C.
Read other articles on optimizing company finances.
Goodwill Company, 2014.
Unfortunately, we are physically unable to provide free consultations to everyone, but our team will be happy to provide services for the implementation and maintenance of 1C. You can find out more about our services on the 1C Services page or just call +7 (499) 350 29 00. We work in Moscow and the region.
Source: https://programmist1s.ru/byudzhet-po-balansovomu-listu/
General principles of organizing budgeting in 1C ERP
Before we begin describing the procedure for constructing a forecast balance, we must say a few words about how budgeting works in 1C ERP.
The key objects of the system, on the basis of which budgeting in the application solution is based, are the budgeting model, scenario, types of budgets (budget forms), items (turnovers) and indicators (remains) of budgets.
Planned indicators are entered in the context of items through the “Budget Copy” documents, and the documents themselves can be filled out either manually (downloaded from Excel files) or filled out automatically based on other budgets.
As for planning in terms of budget indicators (and the forecast balance, due to its specifics, is built on the basis of indicators, not items), then it is good form to set up the reflection of turnover by items on indicators, in which the values of the indicators are fully calculated on the basis of previously entered turnovers according to budget items, rather than requiring manual filling. We will show an example of such a setting below.
Free expert consultation
Natalia Sivorina
Consultant-analyst 1C
Thank you for your request!
A 1C specialist will contact you within 15 minutes.
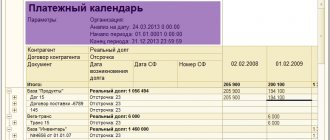
Forecast balance
Example:
Drawing up a forecast balance
We will draw up a forecast balance of assets and liabilities of the enterprise and determine the need for external financing based on the following information.
Sales volume of the reporting period is 200 thousand rubles.
The overwhelming majority of inventories in the balance sheet of an enterprise are raw materials and supplies. Parsing wildberries.ru in more detail.
The company expects to increase sales by 20%, accelerate accounts receivable by 5%, and reduce material costs per unit by 2%.
The increase in sales volume is due to an increase in the physical volume of sales.
The forecast balance includes a 10% level of return on sales based on net profit and a dividend payment rate of 45% of net profit.
An increase in sales volume does not require an increase in non-current assets.
The original balance sheet is presented in Table 2.
Table 2 - Balance sheet (in thousands of rubles)
| Assets | At the end of the year | Passive | At the end of the year |
| Cash | 30 | Accounts payable | 90 |
| Accounts receivable | 35 | Short-term loans | 10 |
| Reserves | 50 | Long-term loans | 30 |
| Current assets | 115 | Equity | 80 |
| Fixed assets | 120 | retained earnings | 25 |
| Balance | 235 | Balance | 235 |
Solution:
a) Determine the forecast amount of funds. Cash changes in proportion to sales growth:
·1.2=36 thousand rubles.
b) Let us determine the index of changes in accounts receivable Idz using formula (2).
, (2)
where Iop is the sales volume index;
IKobDZ is the receivables turnover ratio index.
Idz = 1.2 / 1.05 = 1.14.
The forecast value of accounts receivable will be:
· 1.14 = 39.9 thousand rubles.
V)
Let's determine the inventory change index. Due to the fact that the overwhelming majority of inventories are raw materials, the entire basic balance sheet value of inventories can be calculated without a large error based on the rate of change in material costs. The index of change in material costs, Imz, is determined by formula (3).
IMZ = IOP · IMZud, (3)
where IMZ ud is the index of specific material costs
mz = 1.2 · 0.98 = 1.18.
The amount of inventory will be: 50 · 1.18 = 59 thousand rubles.
d) Current assets will be: 36 + 39.9 + 59 = 134.9 thousand rubles.
d)
Since an increase in sales volume does not require an increase in non-current assets, their value will remain at the level of 120 thousand rubles.
f) Accounts payable are adjusted in proportion to sales growth:
· 1.2 = 108 thousand rubles.
g) The amount of short-term and long-term loans, equity (shareholder) capital remains at the same level.
h) Retained earnings at the end of the forecast period, , are determined by formula (4).
(4)
where OPforecast is the sales volume according to the forecast, thousand rubles;
RsalesPP - return on sales based on net profit, unit share;
Ndivid - rate of payment of dividends, unit shares.
And)
Let's draw up a forecast balance in Table 3.
Table 3 - Forecast balance (in thousand rubles)
| Title of articles | Reporting balance | Forecast balance |
| Assets | ||
| Cash | 30 | 36 |
| Accounts receivable | 35 | 39,9 |
| Reserves | 50 | 59 |
| Current assets | 115 | 134,9 |
| Fixed assets | 120 | 120 |
| BALANCE | 235 | 254,9 |
| Passive | ||
| Accounts payable | 90 | 108 |
| Short-term loans | 10 | 10 |
| Long-term loans | 30 | 30 |
| Own capital (share capital) | 80 | 80 |
| retained earnings | 25 | 38,2 |
| BALANCE | 235 | 266,2 |
Go to page: 1 2 3 4
5
Source: https://www.financejump.ru/suuns-218-4.html
| Indicators | Quarters of the reporting period | |||
| I | II | III | IV | |
| 1. Revenue from sales of products (works, services) | 100 | 100 | 100 | 100 |
| 2. Cost, administrative and commercial expenses | 72,0 | 74,2 | 72,7 | 73,3 |
| 3. Profit from sales | 28,0 | 25,8 | 27,3 | 26,7 |
| 4. Profit of the reporting period | 26,2 | 21,4 | 22,8 | 20,8 |
| 5. Payments to the budget | 8,9 | 7,8 | 8,1 | 7,3 |
| 6. Profit remaining at the disposal of the organization | 17,3 | 13,6 | 14,7 | 13,5 |
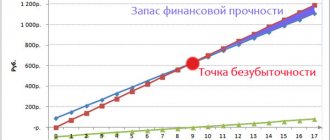
The relative indicator of profit remaining at the disposal of the organization varies from 17.3 to 13.5%, Let us assume that in the forecast quarter it will be at the level of 15%, Then the expected profit amount is:
Pn +1 = [forecasted revenue from product sales] ×
×[profitability];
Пn +1= 48582 × 0.15 = 7288 thousand rubles.
According to the reporting balance for 2010, the amount of equity capital at the end of the year was 31,628 thousand rubles. It can be assumed that it will increase by the amount of the predicted profit, i.e. by 7288 thousand rubles, and will amount to 38916 thousand rubles. Therefore, the average amount of equity capital in the next reporting period will be:
SKn +1 = [31628 +38916] : 2 = 35272 rub.
Non-current assets, according to the balance sheet, amounted to 19,187 thousand rubles at the end of the year. Let us assume that in the forecast period investments in fixed assets are expected in the amount of 4,000 thousand rubles. Then the average value of non-current assets in the forecast period will be:
Imn+1= [19187 +19187+ 4000]: 2 = 21187 thousand rubles.
Based on this, you can determine the amount of the maximum possible accounts payable:
where KZp+1
— accounts payable in the forecast period
SOSp+1
– forecast of own working capital
d Calculation – turnover period of funds in calculations
dКЗ – turnover period of accounts payable
according to observations, dCalc = 350 days
dKZ = 120 days
Given the resulting volume of own current assets and the current turnover, the organization's accounts payable in the forecast period may amount to 32,055.6 thousand rubles.
Consequently, an organization can form current assets with the help of loans.
The total financing requirement (own capital + bank loan) can be determined as follows:
where PFp + 1
— need for financing;
Tap + 1
-the expected value of current assets in the forecast period.
TAp indicator
determined by the average circulation period of capital invested in working capital (inventories, cash, accounts receivable, etc.).
.To establish the value of current assets, it is necessary to have a table of time series of cash turnover, accounts receivable, inventories, as well as the expected value of balances for each item of current assets.
Let us assume that the expected value of current assets ( TAn+1
) in the forecast period will amount to 61439.9 thousand rubles. (i.e. 53426 × 1.15), then:
PFp+1 = 61439.9
X
Consequently, the need for total sources of financing current assets does not exceed the maximum possible amount of own working capital.
Under these conditions, current settlements by creditors are possible subject to the attraction of bank loans. This will affect the duration of the production and commercial cycle.
The turnover of funds will slow down due to rising costs (+% per loan). This will lead to an increase in the gap between the turnover period of current assets and the period for repayment of accounts payable.
Consequently, the need for total capital and the amount of current liabilities will increase.
As a result of calculations, the overall forecast balance will have the following structure (Table 2)
Example of calculating the balance of the previous period
As sales increase, working capital increases. The efficiency of working capital management can be calculated through ratios. Basic working capital ratios in days:
- Material turnover period = Average annual cost of inventories from the balance sheet * 365/Cost price from operating statement;
- Receivables turnover period (AR) = Average annual value of RRP from the balance sheet * 365 / Revenue from profit and loss;
- Accounts payable turnover period (AC) = Average annual cost of accounts payable from the balance sheet * 365 / Cost of operating expenses;
- Cash turnover period (CF) = Average annual cost of CF from the balance sheet * 365 / Revenue from operating profit.
In addition to working capital, the balance sheet asset contains non-working capital, such as fixed assets (fixed assets) and intangible assets (intangible assets). Similar to working capital, efficiency can be calculated using the formula:
- Turnover period of fixed assets and intangible assets = ((Average annual cost of fixed assets - depreciation of fixed assets) + (Average annual cost of fixed assets - depreciation of intangible assets)) / Revenue from operating income.
Let's move on to the passive part of the balance sheet. Most often, the financing of a company’s activities is carried out through borrowed funds (we will discuss the advantages and disadvantages of this approach in the next article). However, interest must be paid on borrowed funds. As the company grows, attracting financing becomes especially important. And here it is important to remember one rule: “the rate of change in net profit must be greater than or equal to the rate of change in revenue” (Tizm.chp>=Tizm.vyr.)
How to correctly calculate the need for financing when growing a company based on its financial condition?