The report on sales of products (form SP-37) has been in use since 1997. Its preparation is significant for stationary retail outlets that provide the necessary documents to control the proceeds from the sale of goods to the manager.
FILES
It is formed on the basis of incoming primary securities. It is most convenient to fill it out once a month, but specific deadlines are not regulated. The main thing is their indication and compliance of the information presented with the actual phenomena of life and the circulation of goods at the point of sale. Can be filled out either electronically or on paper.
Components in the form of different sides
Filling out both sides of the sheet is provided. The first page is a table with specific product names. The second is entirely devoted to the movement of revenue. The first one has a header and a table called “Product Movement”. On the second there is a table “Revenue Movement” with three columns to fill out.
Front side
The paper number is indicated after the name (it is then entered into the accounting registers). Below is the full name of the company, which retail outlet (store) the reporting comes from and who filled it out.
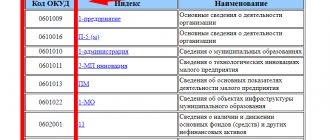
Attention! Don’t forget to fill out the code according to OKUD, OKPO and the date of compilation. This data is fundamentally important for the generation of further accounting statements. OKUD is registered on the form - 0325037.
After the header, data directly about the movement of goods is filled in. The following are written sequentially in the columns:
- product name (column 1);
- units of measurement of goods sold (column 2);
- the cost at which the products were sold (column 3);
- the balance in pieces and the selling price at the beginning of the current month (or the beginning of the formation of the paper, 4 and 5);
- how many goods were received (6.7);
- how many goods were sold (the correspondence of their accounts is also written down here - 8,9, 10 and 11);
- balance of goods in pieces and by value at the end of the month (or the end of the formation period - 12 and 13).
At the end of the first table there is a line “Total” with crosses placed in advance in places not intended for filling. The data only fits into columns 4 through 6 and the last two.
Reverse side
On the second sheet (or last, if the table from the first sheet has more than 9 rows and requires additional space) there is a table with columns:
- indicators;
- sum;
- number and names of documents.
The last column contains the primary papers on the basis of which the data was filled out. They are attached to the document and are its attachments. The number of such applications is indicated separately. All signatures are completed by the senior salesperson or store manager. When submitting, these signatures are accompanied by the signature of the inspector (with a written position and decoding).
Examples of PNL reports: full-fledged
I collected examples of different PNL reports. You can use it as a template for yourself.
In Russian:
of14
OPU-Primer
In English and very detailed:
Profit-and-Loss-Statement
Financial-statements-template
Column "Indicators"
Particular attention is paid to product price indicators. The balance is recorded as of a specific date (or rather, two dates: the beginning and end of the reporting period). It should be introductory and final in the column. Sales proceeds, information regarding the amount along with the existing balance are also mentioned.
The proceeds can be used locally. The facts of such financial management are also recorded in this column.
The special line “Proceeds used” indicates the nuances of on what basis, for what reason and by whom it was spent. If there is revenue and the balance is positive, then the amount can be deposited at the cash desk or deposited directly into a bank account. The last action is required if the organization does not have cash limits established or they have been exceeded. In situations where funds cannot be immediately accepted into a bank's current account, they must still arrive at the banking organization. Data on the exact quantity and amount of receipt is also entered into the described paper.
In addition, financial assets may be temporarily held in post offices (for subsequent transfer). These nuances and special deadlines are due to the fact that the receipt of funds to banking organizations may not occur immediately.
Sample PNL report: simplified
To understand what a simplified PNL table will look like, let's give an example.
- The company's gross revenue is 2,500,000 rubles.
- The cost of production of sold products is 1,300,000 rubles.
- Overhead costs – 450,000 rubles.
- Income tax – 20%.
- There is no interest on borrowed funds.
Making a report:
Based on the results of the report, it can be seen that for the current period the company’s profit has decreased compared to the previous period and the budgeted indicators.
In this situation, you need to find out why sales fell. This could be for various reasons: the general economic situation in the country, an aggressive campaign by competitors, rising costs and a bunch of other things. We carry out a detailed analysis, find the causes, and treat.
What laws is it based on?
The report above contains information that it is a standard intersectoral form under the number SP-37. It is prescribed by Decree of the State Statistics Committee No. 68 of 1997. This resolution has become invalid since in 2013 all standard forms ceased to be mandatory. Nevertheless, in business circles it is customary to formulate reports in this way. There are good reasons for this.
In order to create your own (similar), you need, firstly, to develop it in accordance with Article 9 of Federal Law No. 129-FZ of November 21, 2006, and secondly, attach attachments to the company’s accounting policy regarding new forms of documents .
The presented sample is convenient; its columns do not raise any questions from regulatory organizations. Thus, the lion's share of companies prefer to use an already studied document as the basis for generating their reporting.
Related documents
- Report on the costs of production and sales of products (works, services) of an enterprise (organization). Form No. 5-з (short)
- Report on the availability of exhibits made of precious metals and precious stones. Form No. 4-f (Resolution of the State Statistics Committee of the Russian Federation dated July 12, 1993 No. 129 (as amended dated December 13, 1994 No. 253))
- Report on the accrual and payment of excise taxes on alcoholic beverages
- Report on the supply of goods for export. Form No. 7-ves (Resolution of the State Statistics Committee of the Russian Federation dated July 12, 1994 No. 101)
- Report on the expenditure of state extra-budgetary funds. Form No. 9-f (Resolution of the State Statistics Committee of the Russian Federation dated September 11, 1992 No. 147 (as amended dated December 24, 1993 No. 212))
- Report on the financial results of a medical insurance organization for compulsory medical insurance (quarterly). Form No. 2a-insurer (Order of Rosstrakhnadzor dated April 16, 1996 No. 02-02-12)
- Report on financial results of an insurance organization. Form No. 2-insurer (Order of Rosstrakhnadzor dated April 16, 1996 No. 02-02-12)
- Financial results report form No. 5-f (urgent - monthly)
- Report of an authorized bank on the movement of cash foreign currency (sample of a printed reporting form) (letter of the State Administration of the Central Bank of the Russian Federation of Moscow dated March 1, 1996 No. 15-4-8-856)
- Report of the authorized bank on operations of import and export of currency of the Russian Federation (Regulation of the Ministry of Finance of the Russian Federation dated October 6, 1993 No. 11-05-02.)
- Sample calculation calculation of a bank, branch, department
- Report on the activities of an insurance organization - form No. 1-c (approved by Order of Rosstrakhnadzor dated May 31, 1993 No. 02-02/16 “on approval of urgent telegraph reporting forms for 1993”)
- Report on financial results and their use (Form No. 2 for Okud) (approved by Letter of the Ministry of Finance of the Russian Federation dated October 13, 1993 No. 114 for annual reporting for 1993)
- Report on financial results and their use - form No. 2 - insurer. (approved by the Russian Federal Service for Supervision of Insurance Activities in agreement with the Ministry of Finance of the Russian Federation for quarterly reporting in 1993)
- Plan of income, expenses and profit of a commercial bank
- Appendixes to the balance sheet of the enterprise (form No. 5 for Okud) (approved by Letter of the Ministry of Finance of the Russian Federation dated October 13, 1993 No. 114 for annual reporting for 1993)
- Protocol of agreement on the contract price
- Calculation (final) of the balances of required reserves recorded on balance sheet accounts No. 815 and No. 680 (No. 816 and No. 681) according to the average chronological formula (Order of the Central Bank of the Russian Federation dated March 30, 1996 No. 02-77)
- Calculation (forecast) of the balances of required reserves recorded on balance sheet accounts No. 815 and No. 680 (No. 816 and No. 681) using the average chronological formula (Order of the Central Bank of the Russian Federation dated March 30, 1996 No. 02-77)
- Calculation of changes in the amount of the life insurance reserve for reflection in the financial results statement and determination of the amount of the life insurance reserve at the end of the reporting period (letter of Rosstrakhnadzor dated 04/05/95 No. 09-2-12r-02 (as amended dated 24.0
Report No. 3 Filtering Products by Profitability
Let's return to the original table. Each batch of Goods either made a profit or did not (see the Profit column in the original table). Let's calculate sales by Product Group depending on profitability. To do this, we will filter the records of the source table by the Profit field using formulas.
Let's create a Drop-down (drop-down) list based on Data Validation with the following values: (All); Yes; No . If the filter value (All) is selected, then all records of the source table will be taken into account when calculating sales. If the filter value “Yes” is selected, then only profitable lots of Products will be taken into account; if “No” is selected, then only unprofitable ones will be taken into account.
Total sales will be calculated using the following array formula: =SUMPRODUCT((Original_Table[Group]=A8)* IF($B$5=”(All)”,1,(Original_Table[Profit]=$B$5))* Initial_Table[Sales])
to press CTRL + SHIFT + ENTER instead of simply pressing ENTER .
The number of batches for each group of Products, depending on profitability, can be calculated using a similar formula.
=SUMPRODUCT((Source_Table[Group]=A8)* IF($B$5=”(All)”,1,(Source_Table[Profit]=$B$5)))
This is what the sales report for Product Groups that brought profit will look like.
By selecting the value No in the filter (in cell B 5 ), we will immediately receive a report on sales by Product Groups that caused losses.
Report No. 2 Sales of Products by Region
Let's find the total sales of each Product in the Regions. Let's use the list of Products created for Report No. 1. In a similar way, we will obtain a list of Region names (in the Initial range of the Advanced filter field, enter $D$4:$D$530). Copy the resulting vertical range to the Clipboard and transpose it to horizontal. Place the resulting range containing the names of the Regions in the report header.
In cell B 8 , enter the following formula:
=SUMIFS(Source_Table[Sales]; Source_Table[Product];$A8; Source_Table[Sales Region];B$7)
The formula will return the total sales of the Product, the name of which is located in cell A8 , in the Region from cell B7 . Please note the use of mixed addressing (links $A8 and B$7), it will be needed when copying the formula for the remaining empty cells of the table.
It will not be possible to copy the above formula into the cells on the right using the Fill Marker (this was done for Report No. 1), because in this case, in cell C8 the formula will look like this:
=SUMIFS(Source_Table[Sales, days]; Source_Table[Group];$A8; Source_Table[Sales];C$7)
Links, according to the rules of relative addressing, now began to point to other columns of the source table (those to the right), which, of course, is not correct. by copying the formula from cell B8 to the Clipboard, then pasting it into range C8: G 8 by pressing CTRL + V. You can copy the formula into the cells below using the Fill Marker.
Report No. 4 Statistics on the timing of sales of Products
Let's return to the original table. Each batch of Goods was sold a certain number of days (see the Sales column in the original table). It is necessary to prepare a report on the number of batches that were sold over a period of 1 to 10 days, 11-20 days; 21-30, etc.
We will form the above ranges using simple formulas in column B.
We will calculate the number of batches sold over a certain period of time using the formula FREQUENCY(), which must be entered as an array formula:
=FREQUENCY(Original_Table[Sales, days];A7:A12)
To enter a formula, select the range C6:C12 , then in the Formula Bar, enter the above formula and press CTRL + SHIFT + ENTER .
The same result can be obtained using the usual function SUMPRODUCT(): =SUMPRODUCT((Source_Table[Sales, days]>A6)* (Source_Table[Sales, days]
Three main types of reports
Analysis of sales reports allows you to evaluate the quality of work of your managers and identify problems in a timely manner, and also helps to forecast income, allocate budget and resources. But how often should you collect reports, how to analyze them, and what indicators to pay attention to? The authors of the Pipedrive blog recommend using three types of reports.
Source: gorabbit.ru
Daily report
Forget about revenue and conversion rates for now. The daily report does not talk about results, but only about the number of actions with the base of potential clients over the last 24 hours: how many calls your team makes, holds meetings and sends emails every day. This way you will find out which managers work the hardest and who are outright philanderers.
Back to Contents
Weekly report
Calls, letters and meetings are important not in themselves, but as stages in moving the client towards the most important thing - the deal. And weekly reporting allows you to evaluate how employees work in this direction: how many leads they moved along the sales funnel , and how many clients they lost along the way. When analyzing these reports, it is important to understand how many calls resulted in appointments, and how many commercial proposals resulted in discussion of purchase details.
Monthly report
Finally, long-term sales trends . The monthly report includes key indicators: the number of new clients, average bill, revenue and profit. This report will help you understand:
• sales funnel structure; • conversion value; • team productivity.
The best time for debriefing. At a meeting of department employees, everyone should be given the opportunity to share their thoughts about successes, failures, problems and improvements in activities. Back to Contents
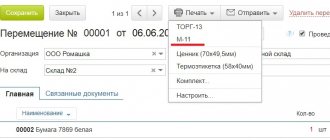
TOP 15 reports that everyone needs
We have compiled a selection of the most popular reports for every businessman, grouped them into categories and demonstrated how easy it is to set them up using SalesapCRM as an example.
Assess manager productivity
Are you sure that your managers are doing everything to ensure that every potential client turns into a buyer and brings you profit? Don't count on this too much, better check what your employees are doing.
1. Create a task report
to see which employees put things off until later and forget about assignments. Looking at the pie chart, it’s immediately clear who doesn’t take their work seriously.
Task report
- The object of analysis is a report on tasks;
- period - day, week, month, quarter or year;
- detailing - any;
- status - expired;
- group - responsible;
- visualization - pie chart.
2. Find out how many applications each manager accepted
, and draw conclusions. Perhaps the results will be unexpected, and Vasily Petrovich, who is constantly talking on the phone, is not at all busy with work matters.
- Hello, LaRonda.
No, I have 4 people on the line, but I can talk. Application report
- The object of analysis is a report on applications;
- period - day, week, month, quarter or year;
- detailing - any;
- stage - we select everything, we are interested in any applications;
- group - responsible;
- visualization - graph.
3. Display the amounts earned by employees (deals won)
to assess the real contribution of each manager to the company's profit. Perhaps someone receives more than they earn.
Report on the amount of won transactions
- The object of analysis is a transaction report;
- period - day, week, month, quarter or year;
- detailing - any;
- stage - everything corresponding to the winnings (payment);
- group - responsible;
- visualization - indicator amount.
4. See how many calls each employee made
. Of course, this is not the only indicator of productivity, but an active manager has a much higher chance of successfully closing a deal.
Report on the number of calls
- The object of analysis is a report on calls;
- period - day, week, month, quarter or year;
- detailing - any;
- type - outgoing;
- group - responsible;
- visualization - graph.
5. Rate by department
to encourage the best and help those who clearly cannot keep up with their colleagues. It would be nice if this report would be visible to everyone in the company - why not provide additional motivation?
Rating of employees by transaction amount
- The object of analysis is a transaction report;
- period - day, week, month, quarter or year;
- detailing - any;
- stage - everything corresponding to the winnings (payment);
- group - responsible;
- visualization - rating by amount.
Visualize your sales funnel
Any business is a journey from the first contact with a client to a successful sale. Or, which also happens, until the deal is lost. Your task is to visualize the sales funnel and identify the bottlenecks - the stages at which you lose a lot of customers.
Source: giphy.com
1. Display a report on the number of leads (contacts) for a specific period
. This is the real number of potential customers that can bring you profit.
Report on new contacts (leads)
- The object of analysis is a report on contacts;
- period - day, week, month, quarter or year;
- detailing - any;
- visualization is an indicator of quantity.
2. Add a report on the number of won trades for the same period
. You will receive a clear answer to the question: how many clients did your managers “bring” to sale. If the number of leads from the previous report is much higher, think about the productivity of managers.
Report on won deals
- The object of analysis is a transaction report;
- period - day, week, month, quarter or year;
- detailing - any;
- stage - everything corresponding to winning;
- visualization is an indicator of quantity.
3. Create a report on the distribution of deals by funnel
to find out at what stage customers are “lost” and optimize business processes in the company. Perhaps customers wait too long for a commercial offer or refuse services after a visit from a not-so-polite technician?
Report on the distribution of deals by funnel
- The object of analysis is a report on tasks;
- period - day, week, month, quarter or year;
- detailing - any;
- funnel - the funnel you want to analyze;
- grouping - stage;
- visualization - funnel.
4. Evaluate the distribution of leads by status using a pie chart
. If it turns out that there are practically no hot clients, then managers are not up to the task and cannot warm the client up to a deal.
Report on the distribution of leads by status
- The object of analysis is a report on contacts;
- period - day, week, month, quarter or year;
- detailing - any;
- grouping - status;
- visualization - pie chart.
5. Compare the effectiveness of two or more funnels
to choose the best option. Conduct your own “investigation”: try selling the same products and services in different ways, and use the report to find out which option converts more leads into buyers.
Comparison of funnel efficiency
- The object of analysis is a transaction report;
- period - day, week, month, quarter or year;
- detailing - any;
- stage - corresponding to winning in two or more funnels;
- grouping - funnel;
- visualization - areas.
The visual graph shows which funnel generates more sales.
Back to Contents
Optimize your company budget
The main thing in optimizing the budget is to reduce the number of expenses as much as possible without suffering damage from such “savings”. Reckless cost cutting can lead to lower profits. Now is the time to determine which expenses you can safely avoid.
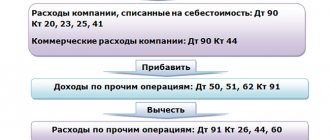
1. Make a general report on income and expenses
to clearly represent the real state of affairs. It might be worse (or hopefully better) than you think.
Source: giphy.com
Funds Flow Report
- The object of analysis is a report on the flow of funds;
- period - month, quarter or year;
- detailing - any;
- status: completed and in processing.
2. Assess income and expenses by line of business
. Perhaps it's time to focus on profitable areas and abandon those that bring minimal income.
Income and expenses by area of activity
- The object of analysis is the profit and loss statement;
- period - day, week, month, quarter or year;
- detailing - any;
- grouping - line of business.
3. Find out the exact receivables of counterparties.
Your income may be truly impressive, but if real money has not yet arrived in your account, it will be of little use.
Accounts receivable report
- The object of analysis is the profit and loss statement;
- period - your period (month, six months or a year from the current date);
- detailing - any;
- status - planned;
- type - arrival.
4. Optimize your advertising budget using end-to-end CRM analytics. To get started, create a report on lead sources
and find out which advertising channels bring the maximum number of applications.
Lead Sources Report
- The object of analysis is a report on contacts;
- period - day, week, month, quarter or year;
- detailing - any;
- grouping - source;
- visualization - pie chart.
5. Don’t rush to abandon sources that don’t generate too many leads. Check the report on the amount earned on transactions from different sources
. It is quite possible that 3 clients from a business conference brought in more money than 50 leads from Yandex.
Income report by source
- The object of analysis is a transaction report;
- period - day, week, month, quarter or year;
- detailing - any;
- stage - everything corresponding to the winnings (payment);
- grouping - source;
- visualization - pie chart or sum indicator.
Monthly, weekly and daily reports in CRM cover all activities of the sales department - from the actions of each individual employee to macro trends. By themselves, they cannot solve the company’s problems, but they allow them to be detected in time and bring maximum leads to purchase. See for yourself with SalesapCRM's analytics features.
Back to Contents