Type of OS cost
There are several concepts of OS price:
- Primary cost, which actually reflects the amount of funds spent on the acquisition of this or that property, which forms the normal operation of the enterprise;
- Recovered value, taking into account the funds spent on restoration, modernization, reconstruction of certain property assets. For example, a company has acquired certain assets that require a series of investments to be used. The price formation will be the sum of the acquisition cost, with the sum of the costs so that this property can be used;
- Residual value. These parameters are formed taking into account depreciation. For example, the cost of a computer is 3,000 rubles, depreciation per month will be 30 rubles, which means that the depreciation amount will be deducted from the principal amount every month, and the residual value will be formed at the end of the year.
The primary cost is formed upon the acquisition of certain property assets, and tax and VAT are not deducted from the amount spent. This amount is formed in the process of forming on one’s own or acquiring certain property, and actually reflects data related to losses incurred. Also, a contribution is placed on the balance sheet of the enterprise, which is directed to the authorized capital of the enterprise. In this case, the parameters of the monetary equivalent are formed. If a company receives some property as a gift, then the property is also put on the balance sheet, and registration is carried out taking into account the calculation of the market value, which was formed on the date of registration of the property. The same structure is formed if some funds are received through barter relationships.
Recovered value is formed by making some significant changes to fixed assets. For example, if this or that property has been reconstructed, modernized or additionally equipped. After which, a revaluation process must be carried out. As you understand, any restoration of property entails the need for some kind of change in the primary value. For example, the property was purchased at a price of 5,000 rubles, modernization and additional equipment were carried out in the amount of 2,000 rubles, which means that the restored value is formed in the amount of 7,000 rubles, and based on this amount, the calculation of the average annual indicators of the operating system is formed.
Calculating the residual value is quite simple, however, you always need to take into account the period of time for which the calculation is carried out. So, the primary cost is, for example, 10,000 rubles, as for depreciation per month, the amount is 100 rubles, which means that after a month the value of this property will be 9,900 rubles, and at the end of the year the cost will be 10,000 rubles - 1,200 rubles = 8800 rubles. And this amount will be transferred to the beginning of the next reporting year as the primary cost of the property asset.
https://youtu.be/_EjkOV0ZqXA
Calculation example
Infinity LLC owns fixed assets subject to property tax, the book value of which as of January 1, 2020 is RUB 1,200,000. Taking into account depreciation, as well as the introduction and removal of assets, the value changed monthly, which was reflected on the balance sheet in the following figures:
- February 1, 2020 - RUB 1,100,000;
- March 1, 2020 - RUB 1,000,000;
- April 1, 2020 - RUB 1,200,000;
- May 1, 2020 - RUB 900,000;
- June 1, 2020 - RUB 1,100,000;
- July 1, 2020 - RUB 1,000,000;
- August 1, 2020 - RUB 900,000;
- September 1, 2020 - RUB 800,000;
- October 1, 2020 - RUB 700,000;
- November 1, 2020 - RUB 900,000;
- December 1, 2020 - RUB 1,000,000;
- December 31, 2020 - RUB 1,100,000.
Let's calculate the average annual and average quarterly value of the property of Infinity LLC:
- for the 1st quarter of 2020: (1,200,000 + 1,100,000 + 1,000,000 + 1,200,000) / 4 = 1,125,000 rubles;
- for the 2nd quarter of 2020: (1,200,000 + 900,000 + 1,100,000 + 1,000,000) / 4 = 1,050,000 rubles;
- for the 3rd quarter of 2020: (1,000,000 + 900,000 + 800,000 + 700,000) / 4 = 850,000 rubles;
- for 2020: (1,100,000 + 1,000,000 + 1,200,000 + 900,000 + 1,100,000 + 1,000,000 + 900,000 + 800,000 + 700,000 + 900,000 + 1,000,000 + 1 10 0 000) / 13 = 900,000 rub.
For the convenience of entrepreneurs, when calculating the average quarterly and average annual value of property, you can use successfully functioning online calculators, where you only need to insert your own accounting indicators.
How is OS calculated?
There are various ways to calculate OS. At the same time, each option has its own specific features. Most often, to conduct analytical studies, as well as to calculate the tax burden, accurate data is required; accordingly, you need to accurately determine the time when the purchase was made, you need to evaluate all the nuances of depreciation, and the calculation is carried out exactly for the year.
When calculating OS indicators, the following formulas are most often used:
- Average annual indicators of fixed assets = cost formed at the beginning of the year + cost per month (all depreciation-type expenses are excluded) and the number of months for which the calculation is carried out. For example, the cost of equipment in a laundry at the beginning of the year was 30,000 rubles, depreciation is 300 rubles per month. You need to calculate the parameters for 4 months. This means that in the first month of use the OS amount will be 29,700, the next month 29,400, and 29,100, 28,800. It will be necessary to sum up all the indicators 29,700 + 29,400 + 29,100 + 28,800 = 117,000 rubles. We divide this indicator by 4, and we get the indicator 29,250. This will be an indicator of the average value of fixed assets;
- An additional calculation formula is also formed taking into account the option of introducing and withdrawing certain property for use. So, the following formula is obtained: the average annual indicators of the fixed assets are equal to the amount of funds at the beginning of the year + the value of the property introduced – the value of the withdrawn property. The final amount of property value for a clearly defined period of time is formed. The amount received will need to be divided by the number of months in the reporting period, after which you will receive the average annual indicators of the fixed assets, taking into account the entered and withdrawn property.
How to determine the average annual value of property
The average cost of property for the first half of the year was: (RUB 6,000,000 + RUB 5,950,000 + RUB 5,800,000 + RUB 5,750,000 + RUB 5,700,000 + RUB 5,650,000 + RUB 5,500,000) : (6 + 1) = 5,764,285 rub. The average cost of property for nine months was: (RUB 6,000,000 + RUB 5,950,000 + RUB 5,800,000 + RUB 5,750,000 + RUB 5,700,000 + RUB 5,650,000 + RUB 5,500,000 + RUB 5,450,000 + RUB 5,400,000 + RUB 5,350,000) : (9 + 1) = RUB 5,655,000 The average annual value of property for the year was: (RUB 6,000,000 + RUB 5,950,000 + RUB 5,800,000 + RUB 5,750,000 + RUB 5,700,000 + RUB 5,650,000 + RUB 5,500,000 + RUB 5,450,000 + RUB 5,400,000 + RUB 5,350,000 + RUB 5,200,000 + RUB 5,150,000 + RUB 5,100,000) : (12 + 1) = RUB 5,538,462
How to calculate average annual indicators?
These parameters are applied in accordance with paragraph 1 of Art. 379 of the Tax Code of the Russian Federation for calculating the tax burden on the property of an enterprise. An indication is being formed of the need for legal entities to make an annual payment of tax on fixed assets that are on the balance sheet of the enterprise. To calculate the taxable base, you need to use a specialized formula. After which, based on the result obtained, it will be possible to carry out the procedure for calculating the tax burden.
- To calculate the average annual indicators of fixed assets, you need to compile a table taking into account all the funds that are on the balance sheet of the enterprise, as well as taking into account depreciation for the entire year. For example, an enterprise has a car on its balance sheet, the estimated cost of which is 40,000 rubles, as well as a computer, the cost of which is 4,000 rubles. The depreciation of a car (depreciation per month) is 1000 rubles, and the depreciation of a computer is 100 rubles. You need to calculate the cost at the beginning of the month. For example, 40,000 – 1000 = 39,000 rubles at the beginning of the next month, 38,000 rubles for the third month, etc.;
- All monthly indicators will need to be summed up for the entire year. For example, 40,000 rubles at the beginning of the month, 39,000 rubles for the next month and all other indicators, we get the amount of 414,000 rubles (the total cost of the operating system for the year for the car). We also provide cost calculations using a computer. It turns out that for the first month the cost will be 4,000 rubles, for the next month 3,900, etc. We get the amount for the year - 41,400;
- The annual indicator is divided by the number of months (which are defined by a clearly established period). In our case, the indicator is 12 and we get the amount for the car - 34,500 rubles (average annual fixed asset indicator). Using the computer, the average annual figure is 41,400/12 = 3,450 rubles;
- 4. Now let’s summarize the indicators for the car and computer. We get the amount of fixed assets for the enterprise 3,450 +34,500 = 37,950 rubles.
Thus, the amount of fixed assets for the entire enterprise for the year is calculated, meaning the average indicators for fixed assets. All calculations, including analytics, are carried out using average annual parameters. If the tax burden on property is being calculated, it may be necessary to calculate it taking into account the quarter.
Property tax: calculation formula based on average annual value
Before making a direct calculation of the property tax of organizations, it is necessary to determine the average annual value of property (clause 4 of article 376 of the Tax Code of the Russian Federation):
The tax itself is calculated as follows:
The maximum bet sizes can be found in.
Please note that, as a general rule, organizations must pay advance payments for property tax based on the results of reporting periods (clause 4 of Article 376, clause 3 of Article 379, clause 4.6 of Article 382 of the Tax Code of the Russian Federation). To calculate the amount of the advance payment, you will need to determine the average cost of the property (clause 4 of Article 376 of the Tax Code of the Russian Federation):
That is, for example, when calculating the average cost for six months, the denominator will be 7 (6 + 1).
The formula for calculating the advance payment directly is as follows:
The amount of tax to be paid additionally at the end of the year is determined by the formula (clause 2 of Article 382 of the Tax Code of the Russian Federation):
How is the average annual indicators of fixed assets calculated on the balance sheet?
When calculating the average annual indicators of fixed assets on the balance sheet, the data on the cost of funds, which are determined by the balance sheet, are used. In this case, the formula will be like this:
- Average annual value on the balance sheet = book value of fixed assets + indicators of introduced funds, also taking into account data on the balance sheet, divided by 12;
- Next, you will need to calculate the amount of funds that were actually withdrawn from the balance. The formula is used: (liquidation price (12 - P))/12. The liquidation price is used, the parameter of which is multiplied by the difference of 12 and the total amount of time during which the fixed assets functioned. The result obtained is divided by 12;
- The second amount is deducted from the first amount, and we obtain the final indicators of the average annual cost on the balance sheet.
This formula determines the nuances of calculating the value of property on the balance sheet, taking into account the property that was introduced into the organization at a clearly defined moment. If we are talking about a standard calculation from the beginning to the end of the year, then a simpler formula is used, which we present below.
This calculation method is suitable for the internal purposes of the organization, since the book value is determined, and the funds that were introduced and withdrawn from use by the organization are deducted. Practice shows that the most optimal calculation option is the average chronology formula. That is, in fact, the calculation of average parameters, which is carried out to calculate tax deductions.
The balance sheet actually represents indicators that reflect the overall balance sheet indicators of certain assets of the enterprise. The determination procedure is regulated by many federal regulations, and it is very important to take into account that all data in the balance sheet is reflected in a net assessment. In fact, tax deductions, VAT, etc. are deducted from the initial purchase price, which allows you to obtain an accurate parameter of assets on the balance sheet.
The balance sheet forms the definition of fixed assets, both at the beginning of the month (indicators are carried forward from the end of the previous reporting period) and at the end of the year. In the process of forming the balance, depreciation is necessarily taken into account as a type of reduction in the basic price of material assets. To find out everything about depreciation rates, you need to study Order of the Ministry of Finance dated October 31, 2000 No. 94n.
Accordingly, based on book value, the indicators will be calculated as follows:
Residual value is a kind of difference between the parameter of fixed assets, which is formed on account 01, with the credit balance 02, which reflects the depreciation of fixed assets. For example, the cost of acquisition, the initial price is 20,000 rubles, depreciation is 200 rubles per month, which means the book value for the month will be determined in the amount of 19,800 rubles.
Naturally, the average value of indicators can be calculated using the balance sheet. These calculations will be quite accurate, since indicators of the average net asset value are used. Such calculations actually give an idea of the real value of assets, which makes it possible to smooth out possible sharp fluctuations that occur on one of the reporting dates. In fact, the average annual value of assets on the balance sheet represents the average parameter of the indicators over a clearly defined period. In our case, for the calendar year.
The calculation will be carried out in this way: the value of assets at the end of the year on the balance sheet is added to the sum of the value of assets at the beginning of the year, and the resulting amount is divided by two. For example, the cost of a computer is 4,000 rubles, during the year a monthly depreciation deduction is formed = 4000, 3900, 3800, and so on for 12 months. At the end of the year the cost is 2800 rubles. It turns out that we need to sum up the figure of 4,000 and 2,800, we get the amount of 6,800. The sum is divided by two, we get the figure of 3,400. So, we got the average value of assets on the balance sheet for the year.
Balance sheet documents at the beginning of the year reflect the value of the property, taking into account those parameters that were indicated in the reporting documents at the end of the year. For example, the cost of a computer at the end of the calendar year was 2,800 rubles. This amount is transferred to the balance sheet for the next calendar year as the amount at the beginning of the year and the beginning of the month.
The balance sheet calculates the total amount of all assets of the enterprise. Also on the balance sheet is the property that is introduced during the year; the calculation is carried out taking into account the time of introduction, as well as the write-off of certain assets. In this case, you need to use a more detailed calculation formula, using indicators of the initial information of the acquisition, and for the reporting month in which the acquisition was made. Depreciation is deducted for the entire period of use until the end of the year, but average figures will be calculated based on dividing the amounts at the beginning of the month by the number of months while the property was in use. For example, the acquisition was made four months before the end of the calendar year. This means that the first month the amount will be, for example, 4000 rubles, the next month (wear and tear is 200 rubles), the amount at the beginning of the month is 3800 rubles, the next - 3600, and the last month 3400. You need to sum up all the indicators 4000+3800+3600+ 3400 = 14,800 rubles. We divide this amount by 4 months and get 3,700 rubles. This will be an indicator that is summed up with other indicators based on average annual calculations.
In fact, calculating the average annual cost of fixed assets based on balance sheets is the simplest. However, this calculation structure is used exclusively to calculate the specific profitability of an enterprise or organization. Such a calculation structure for calculating tax is considered impossible.
Statistics of fixed assets and production equipment
The formation of market relations involves competition between various producers, in which only those who most effectively use all types of available resources can win. The condition and use of fixed assets is one of the most important aspects of analytical work, since they are the material embodiment of scientific and technological progress. It is possible to identify reserves for increasing the efficiency of their use using a thorough economic analysis.
Balances of fixed assets
The balance of fixed assets is a statistical table, the data of which characterize the volume, structure, reproduction of fixed assets for the economy as a whole, industries and forms of ownership.
The basis for the calculation is the results of revaluations of fixed assets, the results of which determine the ratio of prices of the reporting year and the replacement cost of fixed assets in the base year.
To calculate fixed assets for a number of years in constant, base prices, the following indicators are used: price indices for capital-forming products; price indices for capital investments developed on the basis of average regulatory coefficients for types and groups of fixed assets, as well as for the periods of their acquisition; final statistical revaluation indices by type of fixed assets and sectors of the economy and industry; indices of changes in market prices for fixed assets, obtained from data on their market value.
The calculation of fixed assets at comparable prices is carried out by two methods - index and balance sheet. According to the index method, fixed assets of the reporting year are recalculated based on consolidated indices of changes in prices and tariffs for the period from the base year to the reporting year. According to the balance sheet method, data on the availability of fixed assets on the base date at replacement cost is reduced by the amount of assets disposed of before the reporting year and increased by the amount of fixed assets received during this period. In this case, both funds are recalculated into base year prices using the corresponding price indices.
Note! The balance of fixed assets in average annual prices is necessary for a comprehensive analysis of the availability, dynamics and use of fixed assets for a certain period of time based on average values. Based on this balance, such indicators as capital productivity, capital-labor ratio, average standard service life, degree of wear, etc. are calculated.
Average annual price indices are calculated based on the dynamics of prices for products of capital-forming industries (mechanical engineering and the construction materials industry) according to price statistics. The average annual price index is calculated by month of the reporting period. Average monthly price indices are calculated as the average values of indicators at the beginning and end of each month, and the average annual price index is calculated as the quotient of dividing the sum of average monthly price indices by 12.
For balances of fixed assets, the following balance equation must be observed:
F1 + P = B + F2,
where F1 and F2 are the cost of fixed assets, respectively, at the beginning and end of the period;
P is the cost of funds received during the period;
B is the value of funds disposed of during the period.
Schemes of balance sheets of fixed assets at full cost and minus depreciation are presented in the layouts below (Tables 1, 2).
| Table 1. Scheme of the layout of the balance sheet of fixed assets by book value | ||||||||
| Type of fixed assets | Availability of fixed assets at the beginning of the year | Received in the reporting year | Dissolved in the reporting year | Availability of fixed assets at the end of the year | ||||
| Total | Including | Total | Including | |||||
| commissioning of new fixed assets | other receipts of fixed assets | fixed assets liquidated | other disposal of fixed assets | |||||
| Table 2. Scheme of the layout of the balance sheet of fixed assets by residual value | |||||||
| Type of fixed assets | Availability of fixed assets at the beginning of the year | Received in the reporting year | Dissolved in the reporting year | Availability of fixed assets at the end of the year | |||
| Total | Including the launch of new funds | Total | Including | ||||
| liquidated (written off) funds | depreciation of fixed assets for the year | ||||||
Fixed assets come from various sources. This may be the commissioning of new fixed assets as a result of investments, acquisition, receipt under a gift agreement, contribution of fixed assets as a contribution to the authorized capital, etc. Fixed assets are disposed of for the following reasons: liquidation of objects due to wear and tear, sale to other legal entities , gratuitous transfer, contribution to the authorized capital of other organizations, transfer for long-term lease, etc. The balance sheet can reflect all sources of income and all reasons for disposal by type.
In table 1 all indicators are assessed at residual value, with the exception of the indicator for the commissioning of new funds, which is assessed at the full initial cost. In contrast to the balance sheet at full valuation, in the balance sheet at residual value, one of the reasons for the decrease in value is annual depreciation, which is equal to the depreciation accrued for the year.
Based on balance sheets, statistics calculate a number of indicators characterizing the condition, movement, and use of fixed assets.
Indicators of movement, condition and use of fixed assets
The dynamics of fixed assets in Russia is characterized by the following data.
Indicators of the movement of fixed assets include: the dynamics coefficient, the renewal coefficient, the retirement coefficient of fixed assets.
The dynamics coefficient estimates the change in the value of fixed assets at the end of the period compared to the beginning and is calculated as the ratio of the value of fixed assets at the end of the year to the value of fixed assets at the beginning of the year.
The dynamics coefficient can be calculated using the full and residual value. Comparison of coefficients calculated using different estimates allows us to identify changes in the state of fixed assets. So, if the dynamics coefficient for the full value is less than the dynamics coefficient for the residual value, then the fixed assets were renewed during the period under review, that is, at the end of the period the share of assets without depreciation increased.
The renewal coefficient (Kobnov) characterizes the share of new fixed assets in their total volume (at full estimate) at the end of the period and is calculated using the following formula:
.
The retirement ratio (Kvyb) characterizes the share of retired fixed assets during the period in their total value (at full valuation) at the beginning of the period and is calculated by the formula:
To characterize the process of reproduction of fixed assets, the rate of renewal of fixed assets (Kint) is calculated:
The disposal of fixed assets may occur due to their complete disrepair. To assess the disposal of funds for the specified reason, you can calculate the dilapidation coefficient (Kveth):
The higher the value of this indicator, the lower the intensity of replacement of fixed assets.
Indicators of the condition of fixed assets include the wear and tear coefficient and the serviceability coefficient. These coefficients are calculated at a specific date (usually the beginning and end of the period).
The depreciation rate shows what part of its total value the fixed assets have already lost as a result of their use. The coefficient at the beginning of the period is calculated using the formula:
Kiznosa = Amount of depreciation / P.
The serviceability coefficient shows what part of its total value the fixed assets have retained as of a certain date. The shelf life coefficient at the beginning of the period is calculated as follows:
Usability = Residual value / P.
Example 1
Let us determine the degree of change in the deterioration and suitability of fixed assets at a particular enterprise. The calculation results are presented in table. 3.
| Table 3. Changes in the service life coefficient and depreciation coefficient of fixed assets | ||||
| Index | For the beginning of the year | At the end of the year | Change (+, –) at the end of the year compared to the beginning | |
| absolute value | % | |||
| Fixed assets, million rubles. | 20,5 | 23,2 | +2,7 | 13,2 |
| Residual value of fixed assets, million rubles. | 14,6 | 19,1 | +4,5 | +30,8 |
| Depreciation of fixed assets | 5,9 | 4,1 | –1,8 | –30,5 |
| Usability factor, % | 71,2 | 82,3 | — | +11,1 |
| Wear coefficient, % | 28,8 | 17,7 | — | –11,1 |
The shelf life coefficient at the beginning of the year was 71.2% (14.6 / 20.5 × 100%). The shelf life ratio at the end of the year was 82.3% (19.1 / 23.2 × 100%). The depreciation rate at the beginning of the year was 28.8% (5.9 / 20.5 × 100%). The wear rate at the end of the year was 17.7% (4.1 / 23.2 × 100%).
Indicators of the use of fixed assets include capital productivity and capital intensity. To calculate these indicators, the average cost of fixed assets () is determined in several ways:
1) using the simple arithmetic mean formula:
= (OFn + OFk) / 2;
2) according to the average chronological formula, if the value of fixed assets is known for dates separated by equal periods of time:
where n is the number of periods;
3) according to data on the movement of fixed assets:
where OF1 is the cost of fixed assets at the beginning of the year;
P is the cost of fixed assets received during the year;
B is the cost of fixed assets retired during the year;
t1 - number of months of operation of received fixed assets;
t2 is the number of months of operation of fixed assets retired during the year.
The capital productivity indicator estimates the number of products per ruble of fixed assets. Capital productivity is a direct indicator of the efficiency of use of fixed assets: the higher the capital productivity, the better the use of fixed assets, and vice versa. Capital productivity (FRO) is calculated as the ratio of the output of marketable products to the average cost of fixed assets:
The capital intensity indicator is an inverse indicator of the efficiency of using fixed assets. The lower the level of capital intensity, the more efficiently fixed assets are used. Capital intensity evaluates the level of costs of fixed assets per ruble of manufactured products. Capital intensity (Fe) is calculated using the formula:
To assess the provision of labor with fixed assets, statistics use the capital-labor ratio indicator. The capital-labor ratio estimates the average volume of fixed assets per employee. Capital-labor ratio (Fe) is calculated as the ratio of the average annual value of fixed assets to the average number of employees:
Fv = P /
where is the average number of employees.
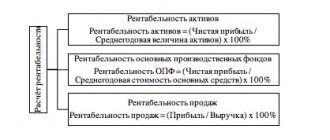
One of the general indicators characterizing the efficiency of use of fixed assets is the profitability of fixed assets. It is defined as the ratio of book profit (Pbal) to the average annual cost of fixed assets (Fosn):
Rosn. f = Pbal / Phosn.
Example 2
Using the above formulas, we will consider the change in general indicators in the organization. We present the initial data and calculation results in Table. 4.
| Table 4. Main general indicators of the use of fixed assets | |||||
| Line no. | Index | For the previous year | For the reporting year | Deviation from the previous year (+, –) | |
| absolute value | % | ||||
| 1 | 2 | 3 | 4 | 5 | 6 |
| 1 | Average annual cost of fixed assets, thousand rubles. | 18 850 | 20 500 | +1650 | +8,7 |
| 2 | Average annual number of employees | 255 | 258 | +3 | +1,2 |
| 3 | Product sales volume, million rubles. | 32 410 | 35 837 | +3427 | +10,6 |
| 4 | Profit (balance sheet), thousand rubles. | 303 | 395 | +92 | +30,4 |
| 5 | Capital productivity, (volume of supplies per one ruble of fixed assets), rub. (page 3 / page 1) | 1,72 | 1,75 | +0,03 | +1,7 |
| 6 | Capital intensity (fixed assets per ruble of supplies), rub. (page 1 / page 3) | 0,58 | 0,57 | –0,01 | –1,7 |
| 7 | Capital-labor ratio (fixed assets per employee), rub. (page 1 / page 2) | 7392 | 7946 | +554 | +7,5 |
| 8 | Labor productivity, thousand rubles. | 12 710 | 13 890 | +1,180 | +9,3 |
| 9 | Capital productivity through capital-labor ratio and labor productivity, rub. | 1,72 | 1,74 | +0,02 | +1,1 |
| 10 | Return on fixed assets, % (page 4 / page 1) | 1,6 | 1,9 | — | +0.3 points |
Analysis of the impact of changes in the efficiency of use of fixed assets on production volume
A change in the volume of production can occur due to a change in capital productivity and the volume of funds. To conduct index analysis, the volume of production and the cost of fixed assets are assessed at comparable prices of the base period. The production volume index (Iq) is equal to the product of the capital productivity index (IFo) and the index of the cost of fixed assets (IOF):
,
where q0, q1 are the volume of production in the base and current periods, respectively;
Fo 0, Fo 1 Fo0, Fo1—capital productivity, respectively, in the base and current periods;
— the average cost of fixed assets in the base and current periods, respectively.
The absolute change in the volume of production in the current period (TP1) compared to the base period (TP0) is determined as follows:
Δmn = TP1 – TP0.
Including:
a) due to changes in capital productivity:
∆Fo = OF1 × (Fo1 – Fo0);
b) due to changes in the average cost of fixed assets:
∆OF = (OF1 – OF0) × Fo0.
Analysis of the use of equipment and production capacity of the enterprise
After analyzing the general indicators of the efficiency of using fixed assets, it is necessary to study in detail the degree of use of the enterprise's production capacities, individual types of machinery and equipment.
Production capacity is understood as the maximum possible output of products at the achieved or intended level of technology, technology and production organization. The maximum power of the equipment is not a constant value; its level may be revised in the process of further optimization of the production process. It is calculated based on the capacity of leading workshops, sections, units, taking into account the implementation of a set of organizational and technical measures aimed at eliminating bottlenecks, and possible production cooperation. The actual power can be equal to the maximum if high equipment efficiency is achieved and the production process is organized in an optimal way.
For example, if, as a result of an analysis of the operation of production lines, it is revealed that the actual capacity differs from the maximum by more than two times, this means that to produce the same volume of products, enterprises where the efficiency of the equipment is high may require half as many units of equipment, than at an enterprise, where such efficiency is significantly lower. Consequently, enterprises that pay due attention to achieving high equipment efficiency have a real opportunity to save money “on all fronts”: they reduce the need for investment, save workshop space, reduce labor costs, etc.
The degree of utilization of production capacity is characterized by the following coefficients:
General coefficient = Actual or planned volume of production / Average annual production capacity of the enterprise,
Intensive coefficient = Average daily production output / Average daily production capacity of the enterprise,
Extensive coefficient = Actual or planned working time fund / Estimated working time fund adopted when determining production capacity.
In the process of analysis, the dynamics of these indicators, the implementation of the plan for their level and the reasons for their changes (commissioning and reconstruction of existing enterprise assets, technical re-equipment of production, reduction of production capacity) are studied.
In addition, the level of use of the enterprise's production space is analyzed: product output in rubles per 1 m2 of production area.
Analysis of equipment operation is based on a system of indicators characterizing the use of its number, operating time, and power.
To characterize the degree of equipment involvement in production, the following indicators are calculated.
Available equipment fleet utilization rate (Kn):
Kn = Amount of equipment used / Amount of available equipment.
Installed equipment fleet utilization rate (Ku):
Ku = Number of equipment used / Number of installed equipment.
The difference between the amount of available and installed equipment, multiplied by the planned average annual production per unit of equipment, is a potential reserve for growth in production by increasing the number of existing equipment.
To characterize the extensive loading of equipment, the use of equipment by time is analyzed: the balance of operating time and its shift ratio (Table 5).
| Table 5. Indicators characterizing the equipment usage time fund | |||
| Time fund indicator | Symbol | Calculation formula | Notes |
| Calendar fund | Tk | Tk = Tk. days × 24 | Tk. days - number of calendar days for the analyzed period, days |
| Nominal (regime) fund | TN | Tn = Tr. cm × tcm | Tr. cm is the number of work shifts for the analyzed period; tcm — duration of work shift, h |
| Effective (real) fund | Tef | Teff = Tn – Tpl | Tpl — scheduled repair time, h |
| Useful (actual) fund | Tf | Tf = Tef – Tpr | Tpr — time of unscheduled downtime, h |
The level of intra-shift use of equipment is characterized by the equipment load factor K3, which makes it possible to estimate the loss of equipment operating time due to scheduled maintenance, etc.:
Kz = Tf / Tk, or Tf / Tn, or Tf / Tef.
The level of conditional use of equipment is characterized by the shift coefficient (Kcm):
Intensive loading of equipment is understood as an assessment of its performance.
Equipment Intensive Load Factor (Ci):
A general indicator characterizing the complex use of equipment is the integral load indicator (Kint):
Kint = Kz × Ki.
In the process of analysis, the dynamics of these indicators, the implementation of the plan and the reasons for their changes are studied.
EXPERT'S COMMENT
O. V. Severin, Head of the Production Planning Department of JSC Unimilk Company
Our company spent three months analyzing the operation of eight pieces of equipment producing identical products at domestic food industry enterprises. As a result of the analysis, it was found that the equipment capacity achieved with the existing production organization varies at different enterprises from 2100 to 3750 tons/month. That is, the difference in the achieved power of equipment purchased from the same supplier reaches 56%. Such a significant difference is due to different levels of equipment operating efficiency, which for the most part is a consequence of the irrational organization of both the production technological process and the labor of production personnel. Naturally, before increasing the power of the equipment, it is necessary to determine how efficiently it operates and what are the limits for increasing the efficiency of the equipment.
Calculation method based on equipment efficiency reporting
The essence of this method is to analyze the statistics of production reports on the operation of equipment, in which employees record all the actions carried out while working on this equipment. Having collected statistics for a certain period, it is necessary to analyze how the production process actually took place, and what exactly the production time was spent on. Using this data, it is easy to track the actual organization of the production process, and then calculate the actual capacity of the equipment. Advantages of the method: accuracy, objectivity, use of actual data for calculations, complete clarity as to what the result consists of. An additional advantage is that the same reporting can later be used to solve other production problems. Disadvantages of this method: it will take some time to implement the above-mentioned reporting on the operation of production equipment and to train production personnel (the workload on personnel will increase).
There are also several methods for estimating the maximum power of equipment, and in essence they are in many ways similar to methods for estimating actual power.
The most optimal method seems to be a calculation based on reporting on the efficiency of equipment operation. This is what we will consider next.
Time accounting loves
Equipment efficiency reporting is compiled to provide detailed accounting of the use of production time. Systems for working with such daily reporting in one form or another have been implemented at the vast majority of foreign manufacturing enterprises, and in essence they are not much different from each other. The physical medium of the report is a form filled out daily during a shift by an enterprise employee responsible for the operation of a specific piece of equipment. The report records all actions carried out during the production process on this equipment. An example of a completed reporting form on the efficiency of equipment operation for a shift (12 hours) is given in Table 6.
| Table 6. Completed equipment efficiency report form for the shift | ||||||||
| Products released, pcs. | Machine speed (pcs/min) | Start time (h, min) | End time (h, min) | Equipment operation (min) | Planned downtime (min) | Unscheduled downtime (min) | Unoccupied time (min) | Action |
| 8:00 | 8:20 | 20 | Warming up the car | |||||
| 22 000 | 100 | 8:20 | 12:00 | 220 | Production of “Sterilized milk” | |||
| 12:00 | 12:30 | 30 | Lunch break | |||||
| 2000 | 100 | 12:30 | 12:50 | 20 | Production of “Sterilized milk” | |||
| 12:50 | 13:30 | 40 | Switch to another product | |||||
| 20 500 | 100 | 13:30 | 16:55 | 205 | Production “Sterilized cream | |||
| 16:55 | 17:15 | 20 | Broken upper bag gripper foot | |||||
| 4500 | 100 | 17:15 | 18:00 | 45 | Production “Sterilized cream | |||
| 18:00 | 18:50 | 50 | Washing | |||||
| 18:50 | 20:00 | 70 | Free time | |||||
| … | … | … | … | … | … | … | … | … |
| Total: 49 000 | 490 | 140 | 20 | 70 | ||||
The data reflected in the report can be used:
- to determine the actual and maximum power of the equipment;
- assessment of the workload of production equipment (current, predicted);
- analysis of how production time is used (primary document about what happened to the equipment in past periods);
- control of planned downtime, determination of standards for their duration;
- calculating key production performance indicators, comparing work results over certain periods of time.
Looking for hidden reserves
Based on the data recorded in the report on the operation of the equipment for the shift, it is possible to estimate the power of the equipment. We'll show you how to do this with an example.
Example 3
Let's use the data in table. 6.
From the report on the efficiency of equipment operation for a shift, the following data can be highlighted:
- the total analysis period (total shift time) is 720 minutes, of which:
— equipment operating time (OO) — 490 min;
— total planned downtime (PP) — 140 minutes;
— total time of unscheduled downtime (UP) — 20 minutes;
— unoccupied time (NV) — 70 min;
- apparatus speed (C) - 100 pcs./min;
- Products produced for the period - 49,000 units.
Based on data on the distribution of working time, it is possible to assess the efficiency of equipment operation for a given period. It is convenient to do this by calculating the conditional indicator “Productivity” (PR), which is one of the key indicators of production efficiency, allowing for its constant monitoring. It is calculated by the formula:
where BP is the minimum operating time required to produce a given amount of product;
PP, VP - duration of planned and unscheduled downtime, respectively.
In our example, the “Productivity” indicator for the shift report is 75.4% (490 / (490 + 140 + 20) × 100%).
The obtained value of the indicator should be interpreted as follows: of the entire period of working time (total time of the period minus non-working time), 75.4% was spent on production (working time), the remaining 24.6% was spent on various types of downtime. It is in the last component that one should look for reserves for a possible increase in productivity and increasing the power of equipment.
Having established the actual value of the “Performance” indicator, we will calculate the actual power of the equipment. To do this, it is recommended to determine the value of this indicator for a period of at least one month, since data on work during just one shift will not be representative for the specified purpose. The "Performance" value for one shift is suitable for monitoring the efficiency of equipment, but not for assessing its capacity.
The power (MS) of equipment for a certain period is calculated using the formula:
MSH = PR × ORP × V,
where PR is the actual value of the “Productivity” indicator, %;
ORP - the total time of the period for which it is required to estimate the power;
V is the operating speed of the equipment.
Let's calculate the daily power of the equipment based on the data given in table. 6:
- equipment operating speed (V) - 6000 pcs./h (100 pcs./min × 60 min);
- equipment productivity - 75.4%;
- The period for which power is determined (ORP) is 24 hours.
Thus, the actual capacity will be equal to: MSH = 0.754 × 6000 × 24 = 108,576 (pcs./day).
In order to calculate the maximum power of the equipment, it is necessary to clearly plan improvements in the organization of the production process. Most often, they are aimed at reducing the duration of planned and unscheduled downtime.
Let’s assume that in our example it is planned to cancel the planned downtime “Lunch break” by hiring additional staff to replace employees having lunch, and the duration of downtime “Wash” is to be reduced from 50 to 30 minutes (thanks to a revision of the washing procedure). It is impossible to implement other improvements, as studies of equipment operation have shown. Thus, the total duration of planned downtime (PP) in the given example would be not 140, but 90 minutes.
Next, you need to recalculate the “Productivity” indicator based on new data, and then recalculate the power. This will be the maximum power: PR = 490 / (490 + 90 + 20) × 100% = 81.7%; MS = 0.817 × 6000 pcs./h × 24 h = 117,648 pcs./day.
So, calculations showed that the planned improvements will increase productivity by 6.3% and increase the power of the equipment in such a way that it will produce 9072 more units of product per day than at actual capacity.
Conclusion
The calculation of average annual indicators of enterprise assets (OS) is carried out using a variety of different formulas, taking into account various values and indicators. The most commonly used calculation structure is using balance sheet parameters. This balance sheet reflects the amount of funds that the company has at the beginning of the reporting period, as well as at the end. In fact, the calculation is carried out taking into account those parameters that were provided on the balance sheet at the beginning and end of the year. These parameters are summed up and then divided by two. So, the total amount is obtained. The accuracy of this calculation formula is quite significant, but it must be taken into account that certain assets of the enterprise are put into operation during the year. The structure for calculating the final parameters will be more complex, since it will be necessary to calculate the amount of assets on the balance sheet, but taking into account the amount of time during which the property was owned by the enterprise.
If it is necessary to calculate average indicators for property tax deductions, a calculation structure is used taking into account indicators for each month, after which all indicators are summed up and divided by the number of months of the reporting period. Moreover, many regional authorities establish rules for such calculations taking into account a quarterly period.
https://youtu.be/bnj0jD8hhpw
Average property value (average annual property value)
2) average annual value of property (when calculating advance payments, the average value of property for
I quarter, half a year or nine months) - to calculate tax for all other objects. The decision to calculate property tax based on the cadastral value of real estate is made by the authorities of the constituent entities of the Russian Federation and formalized by law.
To do this, the results of the cadastral valuation of real estate are first approved - without this, regional authorities have no right to pass laws. Moreover, they must approve and publish in advance lists of specific real estate objects, indicating their cadastral numbers and addresses at which the tax should be determined based on the cadastral value. If a complete set of regional documents has not been prepared by the beginning of the next tax period, the property tax for this period must be calculated based on the average annual (average) value of the property.
Calculation of the average annual cost of fixed assets based on balance sheet data
Fixed assets in the balance sheet are reflected in the asset section I “Non-current assets”, line 1150 “Fixed assets” (Order of the Ministry of Finance dated July 2, 2010 No. 66n). Let us recall that according to this line, fixed assets are reflected in the net valuation, that is, minus the regulatory value in the form of depreciation (clause 35 of PBU 4/99). Thus, the indicator of line 1150 as of the reporting date is formed according to accounting data as follows (Order of the Ministry of Finance dated October 31, 2000 No. 94n):
Debit balance of account 01 “Fixed assets” minus Credit balance of account 02 “Depreciation of fixed assets” (except for depreciation of fixed assets accounted for on account 03 “Income-earning investments in tangible assets”)
Despite the fact that line 1150 is called “Fixed Assets,” fixed assets, strictly speaking, are also reflected in line 1160 “Profitable investments in tangible assets.” After all, profitable investments are also fixed assets. Their difference from “ordinary” fixed assets is that income-generating investments are intended exclusively for provision for temporary possession or use for a fee. That is why they are taken into account separately on account 03 “Income-generating investments in material assets” (clause 5 of PBU 6/01, Order of the Ministry of Finance dated October 31, 2000 No. 94n).
Accordingly, the balance sheet indicator of line 1160 is formed as follows:
Debit balance of account 03 minus Credit balance of account 02 (except for depreciation of fixed assets accounted for on account 01)
Therefore, the answer to the question of how to find the average annual cost of fixed assets based on balance sheet data will depend on whether or not to include profitable investments in the calculation.
If you are only interested in fixed assets accounted for on account 01, the average annual cost of fixed assets (ACV) according to the balance sheet is calculated as follows:
OSSG = (String 1150N + String 1150K) / 2
where Line 1150Н is the indicator of line 1150 as of December 31 of the previous year;
Line 1150K is the indicator of line 1150 as of December 31 of the reporting year.
How to calculate the average annual cost of fixed assets accounted for both in account 01 and in account 03? The formula for the balance sheet data in this case will be as follows:
OSSG = (String 1150N + String 1160N + String 1150K + String 1160K) / 2
where Line 1160Н is the indicator of line 1160 as of December 31 of the previous year;
Line 1160K is the indicator of line 1160 as of December 31 of the reporting year.
How to find the average annual value of property for the tax period formula
To determine the average annual value of real estate, take the residual value of each property reflected in the organization’s accounting data. According to Chapter 30 of the Tax Code of the Russian Federation, in order to determine the average annual value of property for a tax period, it is necessary to add up the residual value (VV) of each real estate item on the first day of each month of the tax period and on the last day of the tax period.
For example: the average annual value of property for 2011 will consist of the value of property on January 1, February 1, March 1, April 1, May 1, June 1, July 1, August 1, September 1, October 1, November 1, December 1 and 31th of December. 4 According to the general rule of tax accounting, divide the resulting number by the number of months in the tax period (since the tax period is a year, their number is 12), increased by one.
This method will be inaccurate if during the reporting year the dynamics of fixed assets was uneven, they were introduced and withdrawn at different rates, therefore such a calculation will give a serious error when applied, for example, to a quarterly accounting period.
- Method taking into account the month of OS I/O. This is also an approximate method, which is, however, more accurate than the first.
It involves adding to the initial cost the amount of funds introduced at a certain time, and, accordingly, subtracting the withdrawn funds. In this case, additional indicators FM1 and FM2 will appear in the formula, meaning the number of full months that have passed since the entry (1) or disposal (2) of the fixed asset.The formula looks like this: ∑average-year. = ∑first beginning
For accounting and tax collection and payment purposes, it is necessary to constantly monitor the book value of the organization’s property. For some important taxes, such as, for example, the key is the average value of fixed assets for the reporting period, and for filing a return for this tax - for the year.
Let's look at the nuances of calculating the average value of property based on the latest legislative acts, give formulas, and look at how this is done using specific examples.
The main purpose of asset accounting
The average annual cost of fixed assets is an indicator that fully reflects the total cost of the company's fixed assets. In the economic activity of any enterprise, accounting of fixed assets pursues such main goals as:
- accumulation of the actual amount of costs incurred that are directly related to the accounting process;
- correct documentation and display of operations for their movement during the specified period;
- calculation of the correct results obtained as a result of the sale of fixed assets and the rest of the disposal;
- calculation of actual losses that occurred in connection with the maintenance of the operating system;
- full control over assets that take part in the accounting process;
- OS usage study;
- obtaining the necessary information about fixed assets that are needed for reporting.
It is important to note that this type of calculation should be made based on the amount of property tax, the payment for which is made by any company in accordance with the current tax legislation. It is also worth taking into account the calculation of indicators of operational use of the operating system, such as capital productivity and capital intensity. The procedure for the accounting process of fixed assets is clearly regulated by current legal acts.
The most significant documents in this regard are considered to be:
- PBU 6/01 “Accounting for fixed assets” No. 26n;
- methodological manual OS No. 91n.
You should also pay attention to these regulatory documents when making calculations. This is explained by the fact that in addition to the purposes of accounting for fixed assets and the conditions that must be met at the same time for the recognition of assets in the accounting process, a certain procedure for the formation of their value is also regulated.
In addition, the price, which is formed according to all current rules specified in the documents, will be further used in the process of calculating the average annual value of assets. The calculation of the average annual value when calculating the tax on existing property is, first of all, based on such a legal basis as:
- Article 376 of the Tax Code of the Russian Federation;
- Letters from the Ministry of Finance No. 03-05-05.
Types of OS costs
According to the above legal acts, OS can have several types of value, namely:
- primary;
- restorative;
- residual.
Please note: if we talk about the primary type of value, it is formed as a result of placing fixed assets on accounting records.
The entire process of its creation is described in detail in PBU 6/01 and largely depends on the option for the company to receive assets:
- in the process of acquisition or formation on its own, - this is the amount of losses actually incurred by the company, which are directly related to purchases or formation. It is worth noting that in this case, payment of VAT and other taxes are not taken into account;
- in the process of receiving a contribution to the authorized capital of the company, this means the valuation of assets in a monetary unit that is agreed upon between the founders of the company;
- upon receipt of a gift, this means the market cost of assets, which is relevant as of the date of registration;
- in the process of receiving under barter agreements, - the cost of the transferred values.
If we talk about changing the primary value, this is only possible in such cases as:
- the process of fundamental changes in fixed assets. This is possible during retrofitting, reconstruction, modernization, and so on;
- OS revaluation process.
As for replacement cost, it can be carried out in such cases as:
- restoration of property, which entails a change in primary value;
- carrying out revaluation or depreciation of the property itself.
As for the residual value, it means the primary cost, but minus depreciation.
Why do you need to calculate the average value of property?
Property (fixed assets) constantly changes its residual value, gradually transferring it to the products produced by the organization or the work performed or services provided. At the same time, their material, “material” form is preserved. Therefore, constant accounting and adjustment of their value in the balance sheet is necessary, which will reflect both the form of the asset and the amount of “transferred” value (depreciation).
In addition, since fixed assets (fixed assets) are dynamic, during the reporting period they can:
- change your qualitative state;
- get an “upgrade” and thereby increase the value;
- become obsolete physically and morally;
- change the total volume (the organization wrote off, sold or acquired property assets).
IMPORTANT!
It follows that at the beginning of the reporting year, the residual value of fixed assets may differ sharply from the indicators at the end of this period. That is why average values are used in calculations, which increases the accuracy and reliability of accounting and reflection of the value of funds on the balance sheet.
In addition to the immediate tasks of accounting, the value of the organization’s property, determined as the average value for the selected period, is used for taxation purposes. This indicator represents the taxable base for corporate property tax. On its basis, the amount of advance quarterly payments and the final annual payment is calculated (clause 1 of Article 375 of the Tax Code of the Russian Federation), it forms the basis of the declaration for this tax.
Calculation of the average annual cost of fixed assets
If we are talking about how to find the average annual cost of fixed assets, then we can use several methods. In this case, the choice of method for calculating the operating system directly depends on the purpose of the calculation and the required accuracy that should be obtained in the end. Thus, the calculation formula below does not imply OS I/O. This is practiced when special precision is not necessary.
Basic formulas for calculating the cost of operating systems
You can calculate the average annual reporting of fixed assets in the following way:
Average_price = (Price (year) + Price (year))/2, where Price (year) and Price (year) – the price of fixed assets, as of January 1 and 31 December of the year for which the calculation is made.
It is worth noting that the price on December 31 can be calculated using the following formula:
Price (k.g.) = Price (n.g.)+Price (input) - Price (select), where Price (select) and (input) is the price of fixed assets directly entered and written off throughout the year.
Please note: An important point is that the book value of the residual funds must be used in all calculations.
There are several methods for calculating the cost of an OS.
Calculation of the average annual full accounting value of fixed assets
If it is necessary to obtain more accurate calculations, it is also necessary to take into account the month in which the fixed assets were written off or introduced. To find out how to calculate the average annual total accounting value of fixed assets, we turn to using one of several formulas that we will consider next. The most popular formula that is used when calculating the operating system indicator (capital productivity, capital intensity, etc.) looks like this:
St. average = St. (n.g.) + P1/12xSt. (input) - P2/12xSt. (select), where P1 and P2 are the total number of months that have passed since the date of entry and write-off fixed assets.
Also, here is the average chronological formula:
Average value = /12, where:
- st-st (1n.m), St-st (2n.m),…St-st (Nn.m) – the price of fixed assets at the beginning of the 1st, 2nd, Nth month;
- st-st (1k.m), St-st (2k.m),…St-st (Nk.m) – the price of fixed assets at the end of the 1st, 2nd, Nth month.
Property tax calculation
To carry out calculations when calculating company property tax, the following formula is used:
Average St. = (St. (n1) + St. (n2) +…+ St. (nn) + St. (k)) /13, where
- st-st (n1), St-st (n2)… St-st (nn) – residual price of fixed assets on the first day of the 1st, 2nd... month of the tax period;
- st-st(k) – residual price of fixed assets as of the last dates of the tax period;
- 13 is the number obtained by adding one to the 12 months of the tax period.
Please note: when calculating advance payments for 3,6 or 9 months, the denominator is obtained by summing the unit to these months. It is important to note that when making such calculations of fixed assets, the assets and tax base directly to which the cadastral value was used are not taken into account.
For accounting, the period of use of fixed assets must be at least 12 months
Calculation of the average annual cost of fixed assets on the balance sheet
The following formula will help you learn how to calculate the average annual cost of fixed assets on the balance sheet. It looks like:
Fo = Fp (balance sheet) + (Fvv * KR) / 12 – (Fl * (12 - P)) / 12, where
- FP (balance sheet), - balance sheet of the OS;
- Fvv, - funds introduced;
- KR, - total number of months;
- Fl, - Liquidation price;
- P, is the total number of months in which the OS operated during the current year.
The most inaccurate is the method of calculating the cost of fixed assets, which does not take into account the month in which fixed assets were introduced or written off. To achieve the most reliable calculation results, it is necessary to apply one of the formulas that take this month into account. As practice shows, the best option is the average chronological formula.
The main distinguishing feature of OS is the longevity of their use. During operation, the cost of the asset is gradually compensated through depreciation charges. The process of determining depreciation charges involves calculating the average annual cost of fixed assets.
How to calculate the average annual value of property
Calculation algorithm 12/31/2016 12/31/2017 Fixed assets 130 250 190 (130 + 250): 2 Read about the calculation of profitability in the article “The procedure for calculating the profitability of an enterprise (formula).”
But the cost of fixed assets calculated in this way will not be suitable for determining the tax. Results The average and average annual cost of fixed assets, calculated from their residual value, are needed when determining the base for property tax.
The average cost is used in calculations for reporting periods, and the annual average is used when calculating the amount of tax for the year. Attention
The algorithms for determining them are identical: the residual value of the fixed assets is summed up for the first months of the period and on its last day, and then divided by the number of terms involved in the calculation. In this case, the zero values of the amounts must also be used.
What applies to fixed assets
These assets include property that supports the production and management process of the company - buildings, structures, plots of land, perennial plantings, machine tools, equipment, power machines, vehicles, etc. The cost of recorded fixed assets is formed from the costs aimed at their acquisition (manufacturing), and is gradually repaid by monthly depreciation. This is carried out using one of the methods chosen by the company and enshrined in the accounting policy (clause 48 of PBU dated July 29, 1998 No. 34n):
- reducing balance;
by the sum of numbers of years of SPI (useful life);
in proportion to the volume of output (work, services).
Please note that not all fixed assets are depreciated. For example, land, environmental management facilities, road facilities, museum exhibits, housing stock, mobilization funds in conservation, as well as property owned by non-profit organizations are not subject to traditional depreciation charges.
In terms of liquidity, fixed assets are considered low-liquidity assets, since it is often impossible to immediately turn them into means of payment and quickly sell them if necessary.
Using the average annual cost of OPF in economic analysis
Let's consider the scope of application of the average annual cost of OPF in the calculation of other economic indicators.
If we take the volume of products produced by an enterprise and divide it by the average annual cost of general production assets, we will obtain a capital productivity ratio, which actually shows how many products produced in monetary terms are per 1 ruble of fixed assets.
If the capital productivity of an enterprise increases over time, this allows us to conclude that the company's capacity is being used efficiently. A decrease in capital productivity, on the contrary, indicates the opposite.
If we take the average annual cost of general production as a dividend, and use the volume of production as a divisor, we get a capital intensity ratio, which allows us to determine what cost of fixed assets is needed to produce a unit of output.
If we divide the average annual cost of OPF by the average number of employees, this will allow us to calculate the capital-labor ratio, which shows the extent to which each of the enterprise’s employees is provided with the necessary means of labor.
If the average annual cost of the general fund is multiplied by the depreciation rate coefficient, which characterizes the operating conditions of the funds, we obtain the amount of depreciation charges for the year. This indicator can be used not only as a retrospective indicator, but also as a forecast indicator when drawing up business plans.
The concept of average annual price (hereinafter - AP) in economics is interpreted as a value that reflects the change in the price of fixed production assets (FAP) throughout the year as a consequence of their commissioning and liquidation. Calculation of the average annual cost is necessary to analyze the economic efficiency of production; it is carried out taking into account the initial cost of funds. We will tell you in the article how the average annual cost of fixed assets is calculated, according to what formula and indicators.
Book value of fixed assets: features and differences from the market
The book value differs significantly from the market value of the property due to the difference between the mechanisms that determine them. The book value of an enterprise is formed by combining the actual expenses incurred for the acquisition of fixed assets by the company, and therefore cannot be an accurate assessment of the value of the asset, since it does not reflect its real market price. Market value always depends on elements of competition, demand and demand. It is formed by the amount that the buyer is able and willing to pay. By and large, these two values are in no way related to each other and can be polar different in the assessment of the same object.
For example, a company's workshop equipment with complete wear and tear (zero cost) is in excellent working condition and is in demand on the market. It will be sold for 1 million rubles. This example demonstrates the significant differences between the residual book value of an asset and its market price.
However, there are also completely opposite cases. For example, a new machine with a book value of 500 thousand rubles. the enterprise is trying to sell, but due to obsolescence, estimated at 200 thousand rubles, it can only be sold for 300 thousand rubles. That is, the book value of the object in this example is greater than the proposed market value, which resulted in a loss-making transaction.
Average annual cost of fixed assets (FPE)
- an indicator that any accountant needs to calculate property taxes. We will explain below how to calculate the indicator and where to get the formula from.
Characteristics of the average annual price of fixed production assets
When making calculations, the accountant must be guided by the following documents in force in the Russian Federation.
| Title of the document | What does it include? |
| PBU 6/01 No. 26n | Accounting for general fund |
| Guidelines for accounting of fixed assets No. 91n dated 10/13/2003 | Rules for the organization of accounting for open pension fund |
| Letter of the Ministry of Finance of the Russian Federation No. 03-05-05-01/55 dated July 15, 2011 | On the average value of property on which property tax is calculated |
| Tax Code of the Russian Federation, art. 376 | Determination of the tax base |